e-governance and citizen information - Universitat Oberta de ...
e-governance and citizen information - Universitat Oberta de ...
e-governance and citizen information - Universitat Oberta de ...

Create successful ePaper yourself
Turn your PDF publications into a flip-book with our unique Google optimized e-Paper software.
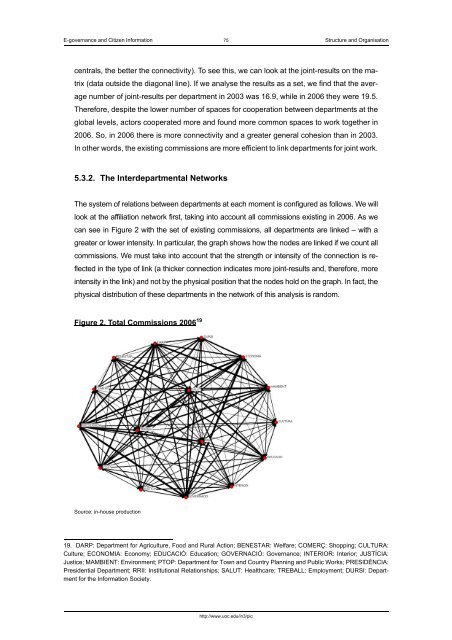
E-<strong>governance</strong> <strong>and</strong> Citizen Information 75 Structure <strong>and</strong> Organisationcentrals, the better the connectivity). To see this, we can look at the joint-results on the matrix(data outsi<strong>de</strong> the diagonal line). If we analyse the results as a set, we find that the averagenumber of joint-results per <strong>de</strong>partment in 2003 was 16.9, while in 2006 they were 19.5.Therefore, <strong>de</strong>spite the lower number of spaces for cooperation between <strong>de</strong>partments at theglobal levels, actors cooperated more <strong>and</strong> found more common spaces to work together in2006. So, in 2006 there is more connectivity <strong>and</strong> a greater general cohesion than in 2003.In other words, the existing commissions are more efficient to link <strong>de</strong>partments for joint work.5.3.2. The Inter<strong>de</strong>partmental NetworksThe system of relations between <strong>de</strong>partments at each moment is configured as follows. We willlook at the affiliation network first, taking into account all commissions existing in 2006. As wecan see in Figure 2 with the set of existing commissions, all <strong>de</strong>partments are linked – with agreater or lower intensity. In particular, the graph shows how the no<strong>de</strong>s are linked if we count allcommissions. We must take into account that the strength or intensity of the connection is reflectedin the type of link (a thicker connection indicates more joint-results <strong>and</strong>, therefore, moreintensity in the link) <strong>and</strong> not by the physical position that the no<strong>de</strong>s hold on the graph. In fact, thephysical distribution of these <strong>de</strong>partments in the network of this analysis is r<strong>and</strong>om.Figure 2. Total Commissions 2006 19Source: in-house production19. DARP: Department for Agriculture, Food <strong>and</strong> Rural Action; BENESTAR: Welfare; COMERÇ: Shopping; CULTURA:Culture; ECONOMIA: Economy; EDUCACIÓ: Education; GOVERNACIÓ: Governance; INTERIOR: Interior; JUSTÍCIA:Justice; MAMBIENT: Environment; PTOP: Department for Town <strong>and</strong> Country Planning <strong>and</strong> Public Works; PRESIDÈNCIA:Presi<strong>de</strong>ntial Department; RRII: Institutional Relationships; SALUT: Healthcare; TREBALL: Employment; DURSI: Departmentfor the Information Society.http://www.uoc.edu/in3/pic