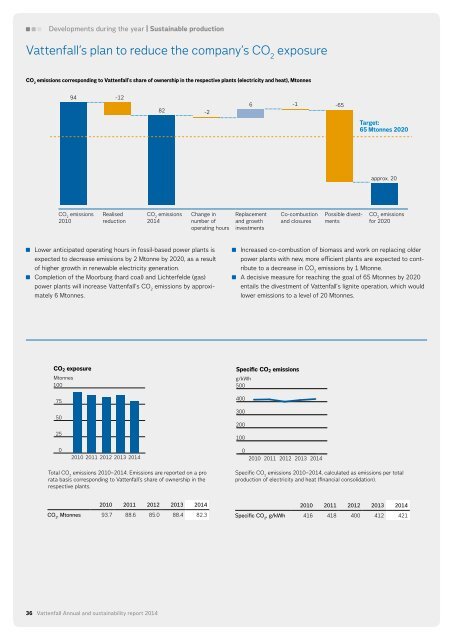
Developments during the year | Sustainable productionVattenfall’s plan to reduce the company’s CO 2exposureCO 2emissions corresponding to Vattenfall’s share of ownership in the respective plants (electricity <strong>and</strong> heat), Mtonnes94 -1282 -26 -1 -65Target:65 Mtonnes 2020approx. 20CO 2emissions2010RealisedreductionCO 2emissions<strong>2014</strong>Change innumber ofoperating hoursReplacement<strong>and</strong> growthinvestmentsCo-combustion<strong>and</strong> closuresPossible divestmentsCO 2emissionsfor 2020Lower anticipated operating hours in fossil-based power plants isexpected to decrease emissions by 2 Mtonne by 2020, as a resultof higher growth in renewable electricity generation.Completion of the Moorburg (hard coal) <strong>and</strong> Lichterfelde (gas)power plants will increase Vattenfall’s CO 2emissions by approximately6 Mtonnes.Increased co-combustion of biomass <strong>and</strong> work on replacing olderpower plants with new, more efficient plants are expected to contributeto a decrease in CO 2emissions by 1 Mtonne.A decisive measure for reaching the goal of 65 Mtonnes by 2020entails the divestment of Vattenfall’s lignite operation, which wouldlower emissions to a level of 20 Mtonnes.CO 2 exposureMtonnes100CO 2 exposureMtonnes100Specific CO 2 emissions Specific CO 2 emissionsg/kWhg/kWh500500755075504003002004003002002525100100002010 2011 2012 2013 2010<strong>2014</strong>2011 2012 2013 <strong>2014</strong>02010201102012 2013 2010 <strong>2014</strong> 201120122013<strong>2014</strong>Total CO 2emissions 2010–<strong>2014</strong>. Emissions are <strong>report</strong>ed on a prorata basis corresponding to Vattenfall’s share of ownership in therespective plants.Specific CO 2emissions 2010–<strong>2014</strong>, calculated as emissions per totalproduction of electricity <strong>and</strong> heat (financial consolidation).2010 2011 2012 2013 <strong>2014</strong>CO 2, Mtonnes 93.7 88.6 85.0 88.4 82.32010 2011 2012 2013 <strong>2014</strong>Specific CO 2, g/kWh 416 418 400 412 42136 Vattenfall Annual <strong>and</strong> <strong>sustainability</strong> <strong>report</strong> <strong>2014</strong>
Customer solutionsthat enable sustainableuse of energyEnsure<strong>sustainability</strong> inthe supply chainSafeguardthe company’sTransform theproduction portfoliotowards lowerCO 2 emissions<strong>and</strong> morerenewablesIncreasefocus on otheremissionsProtect nature<strong>and</strong> species<strong>and</strong> safeguardbiodiversityImprove resourceefficiencyin Vattenfall’soperationsintegrityTakeresponsibilityEnsure afor Vattenfall‘shealthy <strong>and</strong>impacts on localsafe workplaceOur employees communitiesSustainable consumptionSustainable productionIncrease focus on other emissionsDevelopments during the year | Sustainable productionSustainable financial performanceThis area is of major importance for Vattenfall’s continuedlicense to operate. Vattenfall has for many yearsworked on reducing its emissions of, for example, sulphurdioxide, nitrogen oxides <strong>and</strong> airborne particulates byinstalling state-of-the-art flue gas cleaning equipment.Today all of the company’s large plants have effective flue gas cleaningequipments, however, upcoming legislation – mainly associated withimplementation of the Industrial Emissions Directive – may requirefurther reductions in emissions. “Focus on other emissions” alsoinclude spills to soil <strong>and</strong> water. Special attention is paid to oil spills <strong>and</strong>h<strong>and</strong>ling of oil highlighted both from an environmental risk perspective<strong>and</strong> within the environmental incident <strong>report</strong>ing.How is Vattenfall working with this?Vattenfall’s emissions to air occur mainly in combustion plants, themajority of which are coal-fired plants. These emissions are strictlyregulated, <strong>and</strong> ensuring the company’s compliance with environmentalpermits for existing plants has top priority. The main focus is on measuresto reduce emissions, such as installation of flue gas cleaning,where technically <strong>and</strong> economically feasible. To minimise emissions,methods are also developed to gain greater flexibility in power plantprocesses <strong>and</strong> to optimise combustion processes, such as drying oflignite prior to burning.Apart from emissions to air, spills to soil <strong>and</strong> water are also amatter of concern. Spills of oil to soil <strong>and</strong> water can occur during theconstruction <strong>and</strong> operation of power plants <strong>and</strong> in connection withtransport <strong>and</strong> maintenance. In <strong>2014</strong> Vattenfall decided to adopt astronger focus on managing potential oil spills, <strong>and</strong> all operations arerequired to develop action plans for preventing oil spills <strong>and</strong> to identifyimprovement measures.Conventional power plants use large amounts of cooling waterfrom rivers or the sea. The heated cooling water is then returned tothe natural water bodies, which can lead to negative impacts on thebiodiversity of aquatic ecosystems caused by the increase in watertemperature. Vattenfall manages this issue through strict temperatureregulation of the outflowing water in order to prevent potential harmto aquatic flora <strong>and</strong> fauna. See also page 38.Activities during the yearVattenfall’s distribution operations in Sweden work continuouslyon preventing oil spills by replacing old transformers, for example.StrategySecure the company’s continued licence to operate. Specialattention is on preventing spills of oil to water <strong>and</strong> soilTargetsDevelop action plans for preventing oil spills <strong>and</strong> identifyimprovement measuresExamples of regional or local targets:– Reduce emissions of NO xfrom Swedish heating plantsAchievements <strong>2014</strong>New policy adopted for creosote-impregnated poles in thedistribution operations in SwedenUse of dry, pulverised lignite at the Jänschwalde power plantChallengesAdapt all plants to meet the emission levels set by the upcomingIndustrial Emissions DirectiveStrike a balance between actions <strong>and</strong> costs in oil spill managementIn Sweden, the electricity distribution operations adopted a policythat no creosote-impregnated poles are to be used in environmentallysensitive areas. As a result, impregnated wooden poles are notinstalled in parks, nature recreational areas or water protection areas.Creosote-treated poles generally last longer <strong>and</strong> do not need to bereplaced as often, but they contain substances that are hazardousfor both environment <strong>and</strong> health, which leach into the soil. A project iscurrently under way to evaluate poles that have a lower environmentalimpact than creosote-treated poles from a life cycle perspective.At Vattenfall’s power plant in Jänschwalde, Germany, a test phasehas been started involving the use of dry, pulverised lignite instead ofuntreated lignite, which saves large amounts of lignite <strong>and</strong> increasesplant efficiency. This, in turn, is leading to lower emissions of CO 2, NO x,SO 2<strong>and</strong> particulate matter.Planned activitiesThe work on preventing oil spills to water <strong>and</strong> soil continues. Vattenfallis monitoring developments surrounding the Industrial EmissionsDirective in an effort to be able to analyse <strong>and</strong> identify measures formeeting the new requirements.Vattenfall’s emissions of NO x, SO 2<strong>and</strong> airborne particulatesktonnes100g/kWh0.352010 2011 2012 1 2013 <strong>2014</strong> 2NO Xktonnes 70.2 63.6 53.4 56.5 52.8SO 2ktonnes 74.4 69.8 56.1 58.2 53.1800.28Particulates ktonnes 2.4 2.6 1.9 2.1 1.76040200201020112012NO X ktonnesSO 2 ktonnesParticulates ktonnes2013NO X g/kWhSO 2 g/kWh<strong>2014</strong>0.210.140.070NO Xg/kWh 0.318 0.306 0.258 0.268 0.271SO 2g/kWh 0.337 0.336 0.272 0.276 0.272The bars show total levels of SO 2, NO X<strong>and</strong> particulate matter for the years2010–<strong>2014</strong>. The lines indicate specific emissions of SO 2<strong>and</strong> NO X, calculatedas emissions per total production of electricity <strong>and</strong> heat (financial consolidation).The majority of plants already have advanced flue gas cleaning systemsinstalled, <strong>and</strong> the differences between the years are due mainly to differences inproduction levels.1) Figures for 2012 do not include the test operation of Boxberg R.2) Figures for <strong>2014</strong> do not include the test operation of Moorburg.Vattenfall Annual <strong>and</strong> <strong>sustainability</strong> <strong>report</strong> <strong>2014</strong> 37