annual-and-sustainability-report-2014
annual-and-sustainability-report-2014
annual-and-sustainability-report-2014
Create successful ePaper yourself
Turn your PDF publications into a flip-book with our unique Google optimized e-Paper software.
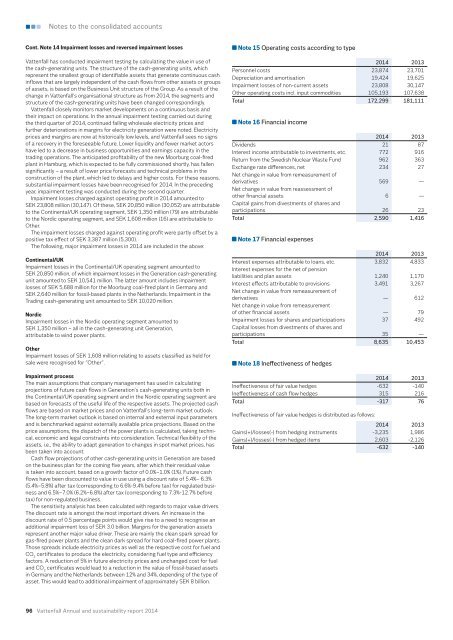
Notes to the consolidated accountsCont. Note 14 Impairment losses <strong>and</strong> reversed impairment lossesVattenfall has conducted impairment testing by calculating the value in use ofthe cash-generating units. The structure of the cash-generating units, whichrepresent the smallest group of identifiable assets that generate continuous cashinflows that are largely independent of the cash flows from other assets or groupsof assets, is based on the Business Unit structure of the Group. As a result of thechange in Vattenfall’s organisational structure as from <strong>2014</strong>, the segments <strong>and</strong>structure of the cash-generating units have been changed correspondingly.Vattenfall closely monitors market developments on a continuous basis <strong>and</strong>their impact on operations. In the <strong>annual</strong> impairment testing carried out duringthe third quarter of <strong>2014</strong>, continued falling wholesale electricity prices <strong>and</strong>further deteriorations in margins for electricity generation were noted. Electricityprices <strong>and</strong> margins are now at historically low levels, <strong>and</strong> Vattenfall sees no signsof a recovery in the foreseeable future. Lower liquidity <strong>and</strong> fewer market actorshave led to a decrease in business opportunities <strong>and</strong> earnings capacity in thetrading operations. The anticipated profitability of the new Moorburg coal-firedplant in Hamburg, which is expected to be fully commissioned shortly, has fallensignificantly – a result of lower price forecasts <strong>and</strong> technical problems in theconstruction of the plant, which led to delays <strong>and</strong> higher costs. For these reasons,substantial impairment losses have been recognised for <strong>2014</strong>. In the precedingyear, impairment testing was conducted during the second quarter.Impairment losses charged against operating profit in <strong>2014</strong> amounted toSEK 23,808 million (30,147). Of these, SEK 20,850 million (30,052) are attributableto the Continental/UK operating segment, SEK 1,350 million (79) are attributableto the Nordic operating segment, <strong>and</strong> SEK 1,608 million (16) are attributable toOther.The impairment losses charged against operating profit were partly offset by apositive tax effect of SEK 3,387 million (5,300).The following, major impairment losses in <strong>2014</strong> are included in the above:Continental/UKImpairment losses in the Continental/UK operating segment amounted toSEK 20,850 million, of which impairment losses in the Generation cash-generatingunit amounted to SEK 10,541 million. The latter amount includes impairmentlosses of SEK 5,688 million for the Moorburg coal-fired plant in Germany <strong>and</strong>SEK 2,640 million for fossil-based plants in the Netherl<strong>and</strong>s. Impairment in theTrading cash-generating unit amounted to SEK 10,020 million.NordicImpairment losses in the Nordic operating segment amounted toSEK 1,350 million – all in the cash-generating unit Generation,attributable to wind power plants.OtherImpairment losses of SEK 1,608 million relating to assets classified as held forsale were recognised for “Other”.Impairment processThe main assumptions that company management has used in calculatingprojections of future cash flows in Generation’s cash-generating units both inthe Continental/UK operating segment <strong>and</strong> in the Nordic operating segment arebased on forecasts of the useful life of the respective assets. The projected cashflows are based on market prices <strong>and</strong> on Vattenfall’s long-term market outlook.The long-term market outlook is based on internal <strong>and</strong> external input parameters<strong>and</strong> is benchmarked against externally available price projections. Based on theprice assumptions, the dispatch of the power plants is calculated, taking technical,economic <strong>and</strong> legal constraints into consideration. Technical flexibility of theassets, i.e., the ability to adapt generation to changes in spot market prices, hasbeen taken into account.Cash flow projections of other cash-generating units in Generation are basedon the business plan for the coming five years, after which their residual valueis taken into account, based on a growth factor of 0.0%–1.0% (1%). Future cashflows have been discounted to value in use using a discount rate of 5.4%– 6.3%(5.4%–5.8%) after tax (corresponding to 6.6%-9.4% before tax) for regulated business<strong>and</strong> 6.5%–7.0% (6.2%–6.8%) after tax (corresponding to 7.3%-12.7% beforetax) for non-regulated business.The sensitivity analysis has been calculated with regards to major value drivers.The discount rate is amongst the most important drivers. An increase in thediscount rate of 0.5 percentage points would give rise to a need to recognise anadditional impairment loss of SEK 3.0 billion. Margins for the generation assetsrepresent another major value driver. These are mainly the clean spark spread forgas-fired power plants <strong>and</strong> the clean dark spread for hard coal-fired power plants.Those spreads include electricity prices as well as the respective cost for fuel <strong>and</strong>CO 2certificates to produce the electricity, considering fuel type <strong>and</strong> efficiencyfactors. A reduction of 5% in future electricity prices <strong>and</strong> unchanged cost for fuel<strong>and</strong> CO 2certificates would lead to a reduction in the value of fossil-based assetsin Germany <strong>and</strong> the Netherl<strong>and</strong>s between 12% <strong>and</strong> 34%, depending of the type ofasset. This would lead to additional impairment of approximately SEK 8 billion.Note 15 Operating costs according to typeNote 18 Ineffectiveness of hedges<strong>2014</strong> 2013Ineffectiveness of fair value hedges -632 -140Ineffectiveness of cash flow hedges 315 216Total -317 76Ineffectiveness of fair value hedges is distributed as follows:<strong>2014</strong> 2013Personnel costs 23,874 23,701Depreciation <strong>and</strong> amortisation 19,424 19,625Impairment losses of non-current assets 23,808 30,147Other operating costs incl. input commodities 105,193 107,638Total 172,299 181,111Note 16 Financial income<strong>2014</strong> 2013Dividends 21 87Interest income attributable to investments, etc. 772 916Return from the Swedish Nuclear Waste Fund 962 363Exchange rate differences, net 234 27Net change in value from remeasurement ofderivatives 569 —Net change in value from reassessment ofother financial assets 6 —Capital gains from divestments of shares <strong>and</strong>participations 26 23Total 2,590 1,416Note 17 Financial expenses<strong>2014</strong> 2013Interest expenses attributable to loans, etc. 3,832 4,833Interest expenses for the net of pensionliabilities <strong>and</strong> plan assets 1,240 1,170Interest effects attributable to provisions 3,491 3,267Net change in value from remeasurement ofderivatives — 612Net change in value from remeasurementof other financial assets — 79Impairment losses for shares <strong>and</strong> participations 37 492Capital losses from divestments of shares <strong>and</strong>participations 35 —Total 8,635 10,453<strong>2014</strong> 2013Gains(+)/losses(-) from hedging instruments -3,235 1,986Gains(+)/losses(-) from hedged items 2,603 -2,126Total -632 -14096 Vattenfall Annual <strong>and</strong> <strong>sustainability</strong> <strong>report</strong> <strong>2014</strong>


