analysis of water injection into high-temperature mixture of ...
analysis of water injection into high-temperature mixture of ...
analysis of water injection into high-temperature mixture of ...

Create successful ePaper yourself
Turn your PDF publications into a flip-book with our unique Google optimized e-Paper software.
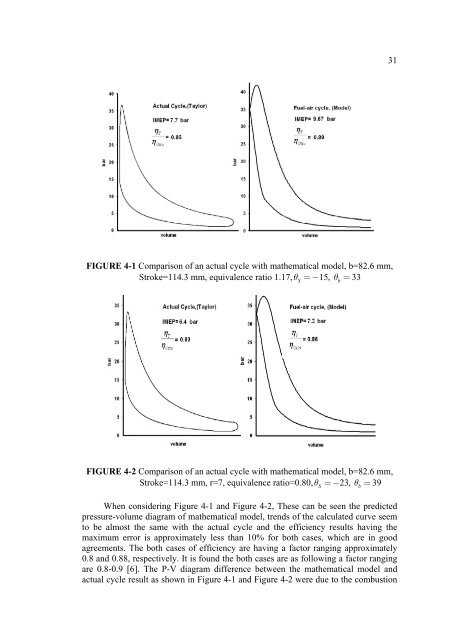
31FIGURE 4-1 Comparison <strong>of</strong> an actual cycle with mathematical model, b=82.6 mm,Stroke=114.3 mm, equivalence ratio 1.17, θ = − 15, θ = 33SbFIGURE 4-2 Comparison <strong>of</strong> an actual cycle with mathematical model, b=82.6 mm,Stroke=114.3 mm, r=7, equivalence ratio=0.80, θ = − 23, θ = 39When considering Figure 4-1 and Figure 4-2, These can be seen the predictedpressure-volume diagram <strong>of</strong> mathematical model, trends <strong>of</strong> the calculated curve seemto be almost the same with the actual cycle and the efficiency results having themaximum error is approximately less than 10% for both cases, which are in goodagreements. The both cases <strong>of</strong> efficiency are having a factor ranging approximately0.8 and 0.88, respectively. It is found the both cases are as following a factor rangingare 0.8-0.9 [6]. The P-V diagram difference between the mathematical model andactual cycle result as shown in Figure 4-1 and Figure 4-2 were due to the combustionSb