analysis of water injection into high-temperature mixture of ...
analysis of water injection into high-temperature mixture of ...
analysis of water injection into high-temperature mixture of ...

Create successful ePaper yourself
Turn your PDF publications into a flip-book with our unique Google optimized e-Paper software.
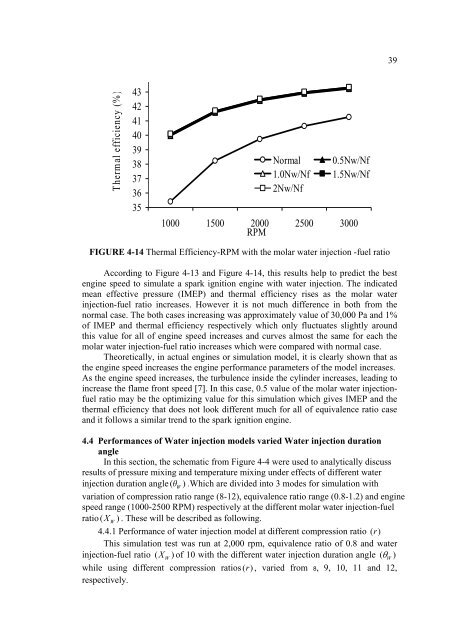
39Thermal efficiency (%)434241403938373635Normal1.0Nw/Nf2Nw/Nf0.5Nw/Nf1.5Nw/Nf1000 1500 2000 2500 3000RPMFIGURE 4-14 Thermal Efficiency-RPM with the molar <strong>water</strong> <strong>injection</strong> -fuel ratioAccording to Figure 4-13 and Figure 4-14, this results help to predict the bestengine speed to simulate a spark ignition engine with <strong>water</strong> <strong>injection</strong>. The indicatedmean effective pressure (IMEP) and thermal efficiency rises as the molar <strong>water</strong><strong>injection</strong>-fuel ratio increases. However it is not much difference in both from thenormal case. The both cases increasing was approximately value <strong>of</strong> 30,000 Pa and 1%<strong>of</strong> IMEP and thermal efficiency respectively which only fluctuates slightly aroundthis value for all <strong>of</strong> engine speed increases and curves almost the same for each themolar <strong>water</strong> <strong>injection</strong>-fuel ratio increases which were compared with normal case.Theoretically, in actual engines or simulation model, it is clearly shown that asthe engine speed increases the engine performance parameters <strong>of</strong> the model increases.As the engine speed increases, the turbulence inside the cylinder increases, leading toincrease the flame front speed [7]. In this case, 0.5 value <strong>of</strong> the molar <strong>water</strong> <strong>injection</strong>fuelratio may be the optimizing value for this simulation which gives IMEP and thethermal efficiency that does not look different much for all <strong>of</strong> equivalence ratio caseand it follows a similar trend to the spark ignition engine.4.4 Performances <strong>of</strong> Water <strong>injection</strong> models varied Water <strong>injection</strong> durationangleIn this section, the schematic from Figure 4-4 were used to analytically discussresults <strong>of</strong> pressure mixing and <strong>temperature</strong> mixing under effects <strong>of</strong> different <strong>water</strong><strong>injection</strong> duration angle ( θ W) .Which are divided <strong>into</strong> 3 modes for simulation withvariation <strong>of</strong> compression ratio range (8-12), equivalence ratio range (0.8-1.2) and enginespeed range (1000-2500 RPM) respectively at the different molar <strong>water</strong> <strong>injection</strong>-fuelratio ( X ) W. These will be described as following.4.4.1 Performance <strong>of</strong> <strong>water</strong> <strong>injection</strong> model at different compression ratio ( r)This simulation test was run at 2,000 rpm, equivalence ratio <strong>of</strong> 0.8 and <strong>water</strong><strong>injection</strong>-fuel ratio ( XW) <strong>of</strong> 10 with the different <strong>water</strong> <strong>injection</strong> duration angle ( θW)while using different compression ratios ( r), varied from 8, 9, 10, 11 and 12,respectively.