analysis of water injection into high-temperature mixture of ...
analysis of water injection into high-temperature mixture of ...
analysis of water injection into high-temperature mixture of ...

You also want an ePaper? Increase the reach of your titles
YUMPU automatically turns print PDFs into web optimized ePapers that Google loves.
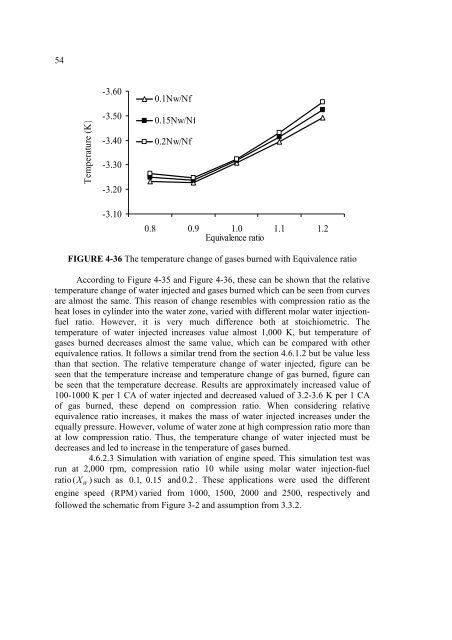
54Temperature (K)-3.60-3.50-3.40-3.30-3.20-3.100.1Nw/Nf0.15Nw/Nf0.2Nw/Nf0.8 0.9 1.0 1.1 1.2Equivalence ratioFIGURE 4-36 The <strong>temperature</strong> change <strong>of</strong> gases burned with Equivalence ratioAccording to Figure 4-35 and Figure 4-36, these can be shown that the relative<strong>temperature</strong> change <strong>of</strong> <strong>water</strong> injected and gases burned which can be seen from curvesare almost the same. This reason <strong>of</strong> change resembles with compression ratio as theheat loses in cylinder <strong>into</strong> the <strong>water</strong> zone, varied with different molar <strong>water</strong> <strong>injection</strong>fuelratio. However, it is very much difference both at stoichiometric. The<strong>temperature</strong> <strong>of</strong> <strong>water</strong> injected increases value almost 1,000 K, but <strong>temperature</strong> <strong>of</strong>gases burned decreases almost the same value, which can be compared with otherequivalence ratios. It follows a similar trend from the section 4.6.1.2 but be value lessthan that section. The relative <strong>temperature</strong> change <strong>of</strong> <strong>water</strong> injected, figure can beseen that the <strong>temperature</strong> increase and <strong>temperature</strong> change <strong>of</strong> gas burned, figure canbe seen that the <strong>temperature</strong> decrease. Results are approximately increased value <strong>of</strong>100-1000 K per 1 CA <strong>of</strong> <strong>water</strong> injected and decreased valued <strong>of</strong> 3.2-3.6 K per 1 CA<strong>of</strong> gas burned, these depend on compression ratio. When considering relativeequivalence ratio increases, it makes the mass <strong>of</strong> <strong>water</strong> injected increases under theequally pressure. However, volume <strong>of</strong> <strong>water</strong> zone at <strong>high</strong> compression ratio more thanat low compression ratio. Thus, the <strong>temperature</strong> change <strong>of</strong> <strong>water</strong> injected must bedecreases and led to increase in the <strong>temperature</strong> <strong>of</strong> gases burned.4.6.2.3 Simulation with variation <strong>of</strong> engine speed. This simulation test wasrun at 2,000 rpm, compression ratio 10 while using molar <strong>water</strong> <strong>injection</strong>-fuelratio ( XW) such as 0.1 , 0.15 and 0.2 . These applications were used the differentengine speed (RPM) varied from 1000, 1500, 2000 and 2500, respectively andfollowed the schematic from Figure 3-2 and assumption from 3.3.2.