analysis of water injection into high-temperature mixture of ...
analysis of water injection into high-temperature mixture of ...
analysis of water injection into high-temperature mixture of ...

You also want an ePaper? Increase the reach of your titles
YUMPU automatically turns print PDFs into web optimized ePapers that Google loves.
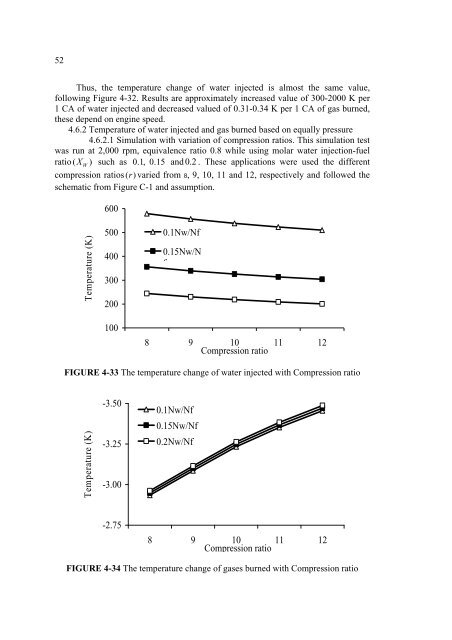
52Thus, the <strong>temperature</strong> change <strong>of</strong> <strong>water</strong> injected is almost the same value,following Figure 4-32. Results are approximately increased value <strong>of</strong> 300-2000 K per1 CA <strong>of</strong> <strong>water</strong> injected and decreased valued <strong>of</strong> 0.31-0.34 K per 1 CA <strong>of</strong> gas burned,these depend on engine speed.4.6.2 Temperature <strong>of</strong> <strong>water</strong> injected and gas burned based on equally pressure4.6.2.1 Simulation with variation <strong>of</strong> compression ratios. This simulation testwas run at 2,000 rpm, equivalence ratio 0.8 while using molar <strong>water</strong> <strong>injection</strong>-fuelratio ( XW) such as 0.1, 0.15 and 0.2 . These applications were used the differentcompression ratios ( r)varied from 8, 9, 10, 11 and 12, respectively and followed theschematic from Figure C-1 and assumption.600Temperature (K)5004003002001000.1Nw/Nf0.15Nw/Nf8 9 10 11 12Compression ratioFIGURE 4-33 The <strong>temperature</strong> change <strong>of</strong> <strong>water</strong> injected with Compression ratioTemperature (K)-3.50-3.25-3.000.1Nw/Nf0.15Nw/Nf0.2Nw/Nf-2.758 9 10 11 12Compression ratioFIGURE 4-34 The <strong>temperature</strong> change <strong>of</strong> gases burned with Compression ratio