analysis of water injection into high-temperature mixture of ...
analysis of water injection into high-temperature mixture of ...
analysis of water injection into high-temperature mixture of ...

You also want an ePaper? Increase the reach of your titles
YUMPU automatically turns print PDFs into web optimized ePapers that Google loves.
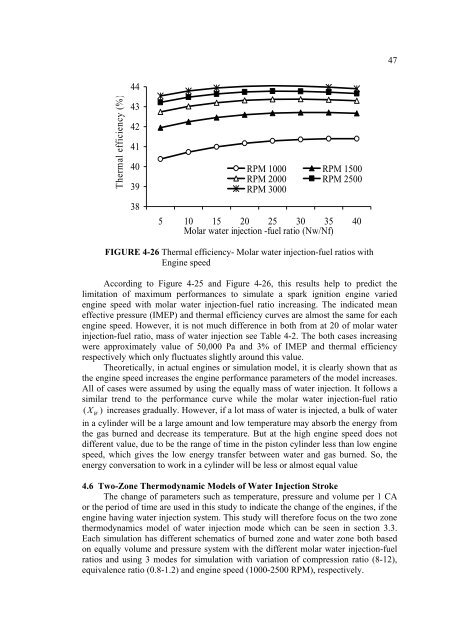
47Thermal efficiency (%)44434241403938RPM 1000 RPM 1500RPM 2000 RPM 2500RPM 30005 10 15 20 25 30 35 40Molar <strong>water</strong> <strong>injection</strong> -fuel ratio (Nw/Nf)FIGURE 4-26 Thermal efficiency- Molar <strong>water</strong> <strong>injection</strong>-fuel ratios withEngine speedAccording to Figure 4-25 and Figure 4-26, this results help to predict thelimitation <strong>of</strong> maximum performances to simulate a spark ignition engine variedengine speed with molar <strong>water</strong> <strong>injection</strong>-fuel ratio increasing. The indicated meaneffective pressure (IMEP) and thermal efficiency curves are almost the same for eachengine speed. However, it is not much difference in both from at 20 <strong>of</strong> molar <strong>water</strong><strong>injection</strong>-fuel ratio, mass <strong>of</strong> <strong>water</strong> <strong>injection</strong> see Table 4-2. The both cases increasingwere approximately value <strong>of</strong> 50,000 Pa and 3% <strong>of</strong> IMEP and thermal efficiencyrespectively which only fluctuates slightly around this value.Theoretically, in actual engines or simulation model, it is clearly shown that asthe engine speed increases the engine performance parameters <strong>of</strong> the model increases.All <strong>of</strong> cases were assumed by using the equally mass <strong>of</strong> <strong>water</strong> <strong>injection</strong>. It follows asimilar trend to the performance curve while the molar <strong>water</strong> <strong>injection</strong>-fuel ratio( X ) Wincreases gradually. However, if a lot mass <strong>of</strong> <strong>water</strong> is injected, a bulk <strong>of</strong> <strong>water</strong>in a cylinder will be a large amount and low <strong>temperature</strong> may absorb the energy fromthe gas burned and decrease its <strong>temperature</strong>. But at the <strong>high</strong> engine speed does notdifferent value, due to be the range <strong>of</strong> time in the piston cylinder less than low enginespeed, which gives the low energy transfer between <strong>water</strong> and gas burned. So, theenergy conversation to work in a cylinder will be less or almost equal value4.6 Two-Zone Thermodynamic Models <strong>of</strong> Water Injection StrokeThe change <strong>of</strong> parameters such as <strong>temperature</strong>, pressure and volume per 1 CAor the period <strong>of</strong> time are used in this study to indicate the change <strong>of</strong> the engines, if theengine having <strong>water</strong> <strong>injection</strong> system. This study will therefore focus on the two zonethermodynamics model <strong>of</strong> <strong>water</strong> <strong>injection</strong> mode which can be seen in section 3.3.Each simulation has different schematics <strong>of</strong> burned zone and <strong>water</strong> zone both basedon equally volume and pressure system with the different molar <strong>water</strong> <strong>injection</strong>-fuelratios and using 3 modes for simulation with variation <strong>of</strong> compression ratio (8-12),equivalence ratio (0.8-1.2) and engine speed (1000-2500 RPM), respectively.