analysis of water injection into high-temperature mixture of ...
analysis of water injection into high-temperature mixture of ...
analysis of water injection into high-temperature mixture of ...

Create successful ePaper yourself
Turn your PDF publications into a flip-book with our unique Google optimized e-Paper software.
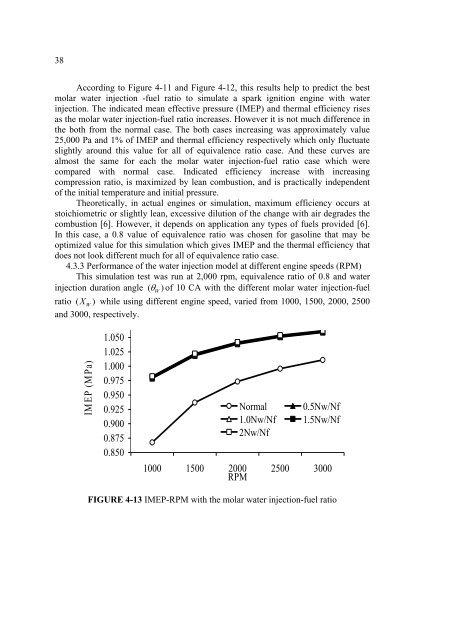
38According to Figure 4-11 and Figure 4-12, this results help to predict the bestmolar <strong>water</strong> <strong>injection</strong> -fuel ratio to simulate a spark ignition engine with <strong>water</strong><strong>injection</strong>. The indicated mean effective pressure (IMEP) and thermal efficiency risesas the molar <strong>water</strong> <strong>injection</strong>-fuel ratio increases. However it is not much difference inthe both from the normal case. The both cases increasing was approximately value25,000 Pa and 1% <strong>of</strong> IMEP and thermal efficiency respectively which only fluctuateslightly around this value for all <strong>of</strong> equivalence ratio case. And these curves arealmost the same for each the molar <strong>water</strong> <strong>injection</strong>-fuel ratio case which werecompared with normal case. Indicated efficiency increase with increasingcompression ratio, is maximized by lean combustion, and is practically independent<strong>of</strong> the initial <strong>temperature</strong> and initial pressure.Theoretically, in actual engines or simulation, maximum efficiency occurs atstoichiometric or slightly lean, excessive dilution <strong>of</strong> the change with air degrades thecombustion [6]. However, it depends on application any types <strong>of</strong> fuels provided [6].In this case, a 0.8 value <strong>of</strong> equivalence ratio was chosen for gasoline that may beoptimized value for this simulation which gives IMEP and the thermal efficiency thatdoes not look different much for all <strong>of</strong> equivalence ratio case.4.3.3 Performance <strong>of</strong> the <strong>water</strong> <strong>injection</strong> model at different engine speeds (RPM)This simulation test was run at 2,000 rpm, equivalence ratio <strong>of</strong> 0.8 and <strong>water</strong><strong>injection</strong> duration angle ( θW) <strong>of</strong> 10 CA with the different molar <strong>water</strong> <strong>injection</strong>-fuelratio ( XW) while using different engine speed, varied from 1000, 1500, 2000, 2500and 3000, respectively.IMEP (MPa)1.0501.0251.0000.9750.9500.9250.9000.8750.850Normal1.0Nw/Nf2Nw/Nf0.5Nw/Nf1.5Nw/Nf1000 1500 2000 2500 3000RPMFIGURE 4-13 IMEP-RPM with the molar <strong>water</strong> <strong>injection</strong>-fuel ratio