<strong>Oceaneering</strong> Common StockOur common stock is listed on the New York Stock Exchange under the symbol OII. Wesubmitted to the New York Stock Exchange during 2011 a certification of our Chief ExecutiveOfficer regarding compliance with the Exchange's corporate governance listing standards. Wealso included as exhibits to our annual report on Form 10-K, as filed with the SEC, thecertifications of our principal executive officer and principal financial officer required underSection 302 of the Sarbanes-Oxley Act of 2002.In June 2011, we effected a two-<strong>for</strong>-one stock split in the <strong>for</strong>m of a stock dividend. All historicalshare and per share data in this annual report reflect this stock split.The following table sets out, <strong>for</strong> the periods indicated, the high and low sales prices <strong>for</strong> ourcommon stock as reported on the New York Stock Exchange (consolidated transaction reportingsystem):For the quarter ended:2011 2010High Low High LowMarch 31 $ 45.55 $ 34.72 $ 33.06 $ 25.65June 30 46.19 35.46 34.30 19.88September 30 45.04 32.71 27.46 21.55December 31 49.26 31.77 38.43 25.81On February 9, 2012, there were 376 holders of record of our common stock. On that date, theclosing sales price, as quoted on the New York Stock Exchange, was $52.45. In 2011, wedeclared quarterly cash dividends of $0.15 per share in each of the second, third and fourthquarters. It is our intent to continue to pay a quarterly cash dividend; however, payment of futurecash dividends will be at the discretion of our board of directors in accordance with applicablelaw, after taking into account various factors, including our financial condition, earnings, capitalrequirements, legal requirements, regulatory constraints, industry practice and any other factorsthat our board of directors believes are relevant.In February 2010, our Board of Directors approved a plan to repurchase up to 12,000,000 sharesof our common stock. Through December 31, 2011 under this plan, we repurchased 2,700,000shares of our common stock <strong>for</strong> $67.0 million. We did not repurchase any shares in the fourthquarter of 2011.8 <strong>Oceaneering</strong> International, Inc.
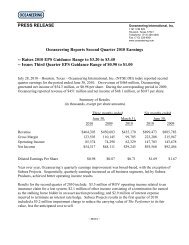
Selected Financial DataThe following table sets <strong>for</strong>th certain selected historical consolidated financial data and should beread in conjunction with Management's Discussion and Analysis of Financial Condition andResults of Operation and our Consolidated Financial Statements and Notes included in thisreport. The following in<strong>for</strong>mation may not be indicative of our future operating results.Results of Operations:Year Ended December 31,(in thousands, except per share amounts) 2011 2010 2009 2008 2007Revenue $ 2,192,663 $ 1,917,045 $ 1,822,081 $ 1,977,421 $ 1,743,080Cost of services and products 1,683,904 1,450,725 1,384,355 1,512,621 1,329,795Gross margin 508,759 466,320 437,726 464,800 413,285Selling, general and administrativeexpense 173,928 156,820 145,610 147,242 123,662Income from operations $ 334,831 $ 309,500 $ 292,116 $ 317,558 $ 289,623Net income $ 235,658 $ 200,531 $ 188,353 $ 199,386 $ 180,374Diluted earnings per share 2.16 1.82 1.70 1.78 1.61Depreciation and amortization,including impairment charges 151,227 153,651 122,945 115,029 93,776Capital expenditures, includingbusiness acquisitions 526,645 207,180 175,021 252,277 233,795Other Financial Data:As of December 31,(in thousands, except ratios) 2011 2010 2009 2008 2007Working capital ratio 1.96 2.24 2.25 2.09 1.98Working capital $ 482,747 $ 543,646 $ 485,592 $ 390,378 $ 331,594Total assets 2,400,544 2,030,506 1,880,287 1,670,020 1,531,440Long-term debt 120,000 — 120,000 229,000 200,000Shareholders’ equity 1,557,962 1,390,215 1,224,323 967,654 915,3102011 Annual Report 9
- Page 3 and 4: Financial Highlights($ in thousands
- Page 5 and 6: In December we secured a three-year
- Page 7: 2011 Financial SectionOceaneering I
- Page 12 and 13: Management's Discussion and Analysi
- Page 14 and 15: Critical Accounting Policies and Es
- Page 16 and 17: We establish valuation allowances t
- Page 18 and 19: In 2009, we used $162 million in in
- Page 20 and 21: For 2011, our ROV revenue and opera
- Page 22 and 23: We earn equity income from our 50%
- Page 24 and 25: Controls and ProceduresDisclosure C
- Page 26 and 27: In our opinion, Oceaneering Interna
- Page 28 and 29: OCEANEERING INTERNATIONAL, INC. AND
- Page 30 and 31: OCEANEERING INTERNATIONAL, INC. AND
- Page 32 and 33: OCEANEERING INTERNATIONAL, INC. AND
- Page 34 and 35: for marine services equipment (such
- Page 36 and 37: segment and its Australian assets a
- Page 38 and 39: Revenue in Excess of Amounts Billed
- Page 40 and 41: elationship and, if it is, the type
- Page 42 and 43: December 31,(in thousands) 2011 201
- Page 44 and 45: in entities or jurisdictions that h
- Page 46 and 47: 4. SELECTED BALANCE SHEET AND INCOM
- Page 48 and 49: On January 6, 2012, we entered into
- Page 50 and 51: Financial Instruments and Risk Conc
- Page 52 and 53: The table that follows presents Rev
- Page 54 and 55: The following table presents Assets
- Page 56 and 57: Geographic Operating AreasThe follo
- Page 58 and 59: equirements. The Compensation Commi
- Page 60 and 61:
in 2011, 2010 and 2009 were subject
- Page 62 and 63:
Forward-Looking StatementsAll state
- Page 64:
Oceaneering International, Inc.1191