In 2009, we used $162 million in investing activities, including $147 million on growing andupgrading our ROV operations.In 2010 and 2009, we received $0.7 million and $1.9 million, respectively, in cash flow fromfinancing activities as proceeds from the sale of our common stock pursuant to the exercise ofemployee stock options. At December 31, 2010, we no longer had any stock optionsoutstanding, and we have had no further stock option activity since then. In addition, in 2011,2010 and 2009, we received $1.3 million, $1.7 million and $2.5 million, respectively, of taxbenefit realized from tax deductions in excess of financial statement expense related to ourstock-based compensation plans. For a description of our incentive plans, see Note 8 to ourConsolidated Financial Statements.In February 2010, our Board of Directors approved a plan to repurchase up to 12,000,000shares of our common stock. The timing and amount of any repurchases will be determined byour management. We expect that any shares repurchased under the new plan will be held astreasury stock <strong>for</strong> future use. The plan does not obligate us to repurchase any particularnumber of shares. Through December 31, 2011, we repurchased 2,700,000 shares at a cost of$67 million under the plan, including the 500,000 shares we repurchased <strong>for</strong> $17.5 millionduring 2011. As of December 31, 2011, we retained 2,799,118 shares we had repurchasedunder this and a prior plan. We expect that shares we reissue will be primarily in connectionwith our stock-based compensation plans.Because of our significant <strong>for</strong>eign operations, we are exposed to currency fluctuations andexchange rate risks. We generally minimize these risks primarily through matching, to theextent possible, revenue and expense in the various currencies in which we operate.Cumulative translation adjustments as of December 31, 2011 relate primarily to our netinvestments in, including long-term loans to, our <strong>for</strong>eign subsidiaries. A stronger U.S. dollaragainst the U.K. pound sterling and the Norwegian kroner would result in lower operatingincome. See Item 7A – "Quantitative and Qualitative Disclosures About Market Risk."Results of OperationsIn<strong>for</strong>mation on our business segments is shown in Note 7 of the Notes to ConsolidatedFinancial Statements included in this report.16 <strong>Oceaneering</strong> International, Inc.
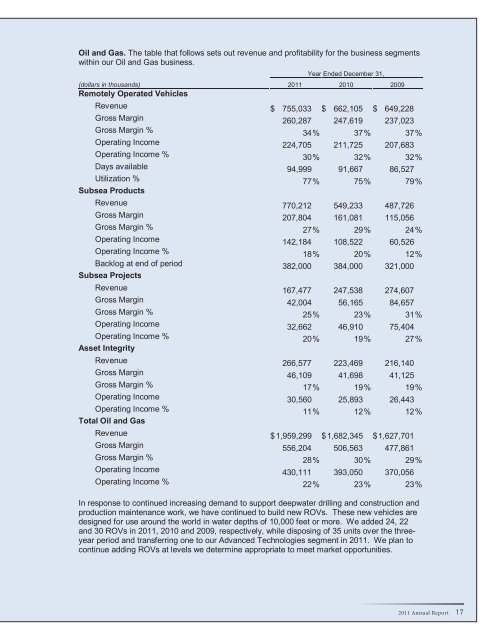
Oil and Gas. The table that follows sets out revenue and profitability <strong>for</strong> the business segmentswithin our Oil and Gas business.Year Ended December 31,(dollars in thousands) 2011 2010 2009Remotely Operated VehiclesRevenue $ 755,033 $ 662,105 $ 649,228Gross Margin 260,287 247,619 237,023Gross Margin % 34 % 37 % 37 %Operating Income 224,705 211,725 207,683Operating Income % 30 % 32 % 32 %Days available 94,999 91,667 86,527Utilization % 77 % 75 % 79 %Subsea ProductsRevenue 770,212 549,233 487,726Gross Margin 207,804 161,081 115,056Gross Margin % 27 % 29 % 24 %Operating Income 142,184 108,522 60,526Operating Income % 18 % 20 % 12 %Backlog at end of period 382,000 384,000 321,000Subsea ProjectsRevenue 167,477 247,538 274,607Gross Margin 42,004 56,165 84,657Gross Margin % 25 % 23 % 31 %Operating Income 32,662 46,910 75,404Operating Income % 20 % 19 % 27 %Asset IntegrityRevenue 266,577 223,469 216,140Gross Margin 46,109 41,698 41,125Gross Margin % 17 % 19 % 19 %Operating Income 30,560 25,893 26,443Operating Income % 11 % 12 % 12 %Total Oil and GasRevenue $ 1,959,299 $ 1,682,345 $ 1,627,701Gross Margin 556,204 506,563 477,861Gross Margin % 28 % 30 % 29 %Operating Income 430,111 393,050 370,056Operating Income % 22 % 23 % 23 %In response to continued increasing demand to support deepwater drilling and construction andproduction maintenance work, we have continued to build new ROVs. These new vehicles aredesigned <strong>for</strong> use around the world in water depths of 10,000 feet or more. We added 24, 22and 30 ROVs in 2011, 2010 and 2009, respectively, while disposing of 35 units over the threeyearperiod and transferring one to our Advanced Technologies segment in 2011. We plan tocontinue adding ROVs at levels we determine appropriate to meet market opportunities.2011 Annual Report 17
- Page 3 and 4: Financial Highlights($ in thousands
- Page 5 and 6: In December we secured a three-year
- Page 7: 2011 Financial SectionOceaneering I
- Page 10 and 11: Oceaneering Common StockOur common
- Page 12 and 13: Management's Discussion and Analysi
- Page 14 and 15: Critical Accounting Policies and Es
- Page 16 and 17: We establish valuation allowances t
- Page 20 and 21: For 2011, our ROV revenue and opera
- Page 22 and 23: We earn equity income from our 50%
- Page 24 and 25: Controls and ProceduresDisclosure C
- Page 26 and 27: In our opinion, Oceaneering Interna
- Page 28 and 29: OCEANEERING INTERNATIONAL, INC. AND
- Page 30 and 31: OCEANEERING INTERNATIONAL, INC. AND
- Page 32 and 33: OCEANEERING INTERNATIONAL, INC. AND
- Page 34 and 35: for marine services equipment (such
- Page 36 and 37: segment and its Australian assets a
- Page 38 and 39: Revenue in Excess of Amounts Billed
- Page 40 and 41: elationship and, if it is, the type
- Page 42 and 43: December 31,(in thousands) 2011 201
- Page 44 and 45: in entities or jurisdictions that h
- Page 46 and 47: 4. SELECTED BALANCE SHEET AND INCOM
- Page 48 and 49: On January 6, 2012, we entered into
- Page 50 and 51: Financial Instruments and Risk Conc
- Page 52 and 53: The table that follows presents Rev
- Page 54 and 55: The following table presents Assets
- Page 56 and 57: Geographic Operating AreasThe follo
- Page 58 and 59: equirements. The Compensation Commi
- Page 60 and 61: in 2011, 2010 and 2009 were subject
- Page 62 and 63: Forward-Looking StatementsAll state
- Page 64: Oceaneering International, Inc.1191