The following table presents Assets, Property and Equipment and Goodwill by businesssegment as of the dates indicated:December 31,(in thousands) 2011 2010AssetsOil and GasRemotely Operated Vehicles $ 861,059 $ 774,011Subsea Products 659,211 511,406Subsea Projects 338,205 249,259Asset Integrity 284,159 90,357Total Oil and Gas 2,142,634 1,625,033Advanced Technologies 62,627 54,378Corporate and Other 195,283 351,095Total $ 2,400,544 $ 2,030,506Property and Equipment, netOil and GasRemotely Operated Vehicles $ 517,098 $ 488,581Subsea Products 184,911 159,505Subsea Projects 141,178 109,761Asset Integrity 30,327 15,238Total Oil and Gas 873,514 773,085Advanced Technologies 9,272 6,143Corporate and Other 10,522 7,145Total $ 893,308 $ 786,373GoodwillOil and GasRemotely Operated Vehicles $ 26,908 $ 27,125Subsea Products 112,817 87,492Asset Integrity 183,292 18,163Total Oil and Gas 323,017 132,780Advanced Technologies 10,454 10,454Total $ 333,471 $ 143,234All assets specifically identified with a particular business segment have beensegregated. Cash and cash equivalents, certain other current assets, certaininvestments and other assets have not been allocated to particular business segmentsand are included in Corporate and Other.52 <strong>Oceaneering</strong> International, Inc.
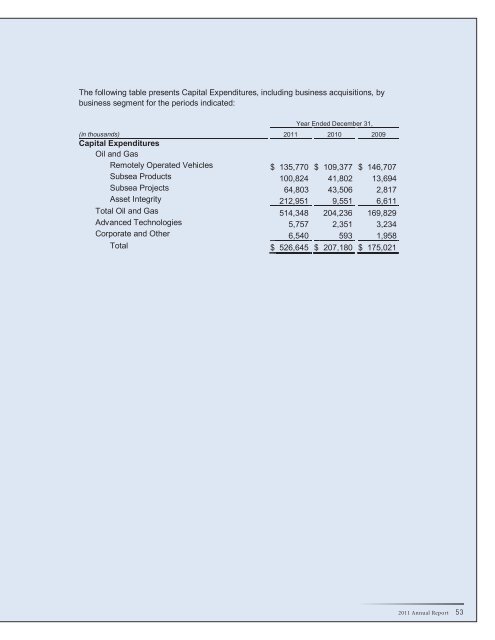
The following table presents Capital Expenditures, including business acquisitions, bybusiness segment <strong>for</strong> the periods indicated:Year Ended December 31,(in thousands) 2011 2010 2009Capital ExpendituresOil and GasRemotely Operated Vehicles $ 135,770 $ 109,377 $ 146,707Subsea Products 100,824 41,802 13,694Subsea Projects 64,803 43,506 2,817Asset Integrity 212,951 9,551 6,611Total Oil and Gas 514,348 204,236 169,829Advanced Technologies 5,757 2,351 3,234Corporate and Other 6,540 593 1,958Total $ 526,645 $ 207,180 $ 175,0212011 Annual Report 53
- Page 3 and 4: Financial Highlights($ in thousands
- Page 5 and 6: In December we secured a three-year
- Page 7: 2011 Financial SectionOceaneering I
- Page 10 and 11: Oceaneering Common StockOur common
- Page 12 and 13: Management's Discussion and Analysi
- Page 14 and 15: Critical Accounting Policies and Es
- Page 16 and 17: We establish valuation allowances t
- Page 18 and 19: In 2009, we used $162 million in in
- Page 20 and 21: For 2011, our ROV revenue and opera
- Page 22 and 23: We earn equity income from our 50%
- Page 24 and 25: Controls and ProceduresDisclosure C
- Page 26 and 27: In our opinion, Oceaneering Interna
- Page 28 and 29: OCEANEERING INTERNATIONAL, INC. AND
- Page 30 and 31: OCEANEERING INTERNATIONAL, INC. AND
- Page 32 and 33: OCEANEERING INTERNATIONAL, INC. AND
- Page 34 and 35: for marine services equipment (such
- Page 36 and 37: segment and its Australian assets a
- Page 38 and 39: Revenue in Excess of Amounts Billed
- Page 40 and 41: elationship and, if it is, the type
- Page 42 and 43: December 31,(in thousands) 2011 201
- Page 44 and 45: in entities or jurisdictions that h
- Page 46 and 47: 4. SELECTED BALANCE SHEET AND INCOM
- Page 48 and 49: On January 6, 2012, we entered into
- Page 50 and 51: Financial Instruments and Risk Conc
- Page 52 and 53: The table that follows presents Rev
- Page 56 and 57: Geographic Operating AreasThe follo
- Page 58 and 59: equirements. The Compensation Commi
- Page 60 and 61: in 2011, 2010 and 2009 were subject
- Page 62 and 63: Forward-Looking StatementsAll state
- Page 64: Oceaneering International, Inc.1191