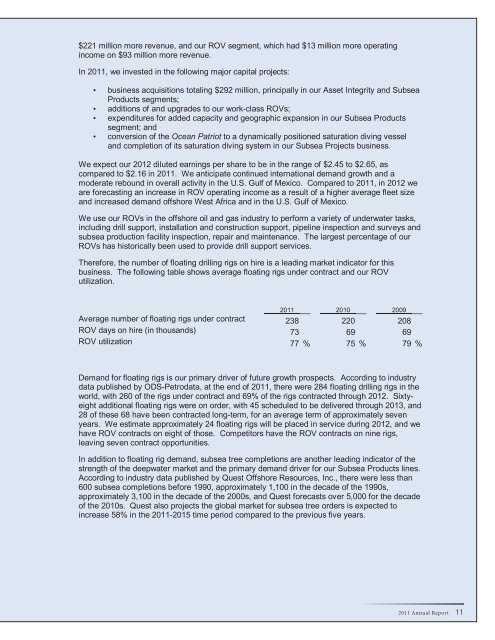
Management's Discussion and Analysis of Financial Condition and Results of OperationsCertain statements in this annual report, including, without limitation, statements regarding thefollowing matters are <strong>for</strong>ward-looking statements made pursuant to the safe harbor provisions ofthe Private Securities Litigation Re<strong>for</strong>m Act of 1995:• our business strategy;• our plans <strong>for</strong> future operations;• industry conditions;• our expectations about 2012 earnings per share and segment operating results, and thefactors underlying those expectations, including our expectations about demand <strong>for</strong> ourdeepwater oilfield services and products as a result of the factors we specify in the"Overview" below;• projections relating to floating rigs to be placed in service and subsea tree orders;• the adequacy of our liquidity and capital resources to support our operations andinternally generated growth initiatives;• our projected capital expenditures <strong>for</strong> 2012;• our plans to add ROVs to our fleet;• our belief that our goodwill will not be impaired during 2012;• the adequacy of our accruals <strong>for</strong> uninsured expected liabilities from workers'compensation, maritime employer's liability and general liability claims;• our belief that our total unrecognized tax benefits will not significantly increase ordecrease in the next 12 months;• our expectations about the cash flows from our investment in Medusa Spar LLC, andthe factors underlying those expectations;• our backlog; and• our expectations regarding the effect of inflation in the near future.These <strong>for</strong>ward-looking statements are subject to various risks, uncertainties and assumptions,including those we refer to under the headings "Risk Factors" and "Cautionary StatementConcerning Forward-Looking Statements" in Part I of our annual report on Form 10-K as filedwith the SEC. Although we believe that the expectations reflected in such <strong>for</strong>ward-lookingstatements are reasonable, because of the inherent limitations in the <strong>for</strong>ecasting process, aswell as the relatively volatile nature of the industries in which we operate, we can give noassurance that those expectations will prove to have been correct. Accordingly, evaluation ofour future prospects must be made with caution when relying on <strong>for</strong>ward-looking in<strong>for</strong>mation.OverviewThe table that follows sets out our revenue and operating results <strong>for</strong> 2011, 2010 and 2009.Year Ended December 31,(dollars in thousands) 2011 2010 2009Revenue $ 2,192,663 $ 1,917,045 $ 1,822,081Gross Margin 508,759 466,320 437,726Gross Margin % 23 % 24 % 24 %Operating Income 334,831 309,500 292,116Operating Income % 15 % 16 % 16 %Net Income 235,658 200,531 188,353During 2011, we generated approximately 89% of our revenue, and 96% of our operatingincome, from services and products we provided to the oil and gas industry. In 2011, ourrevenue increased by 14%, with the largest increase occurring in our Subsea Productssegment. Our Subsea Products segment revenue increased 40% from higher umbilical plantthroughput and specialty product sales.The $236 million consolidated net income we earned in 2011 was the highest in our history.The $35 million increase from 2010 net income was attributable to higher profit contributionsfrom our Subsea Products segment, which had $34 million more operating income on10 <strong>Oceaneering</strong> International, Inc.
$221 million more revenue, and our ROV segment, which had $13 million more operatingincome on $93 million more revenue.In 2011, we invested in the following major capital projects:• business acquisitions totaling $292 million, principally in our Asset Integrity and SubseaProducts segments;• additions of and upgrades to our work-class ROVs;• expenditures <strong>for</strong> added capacity and geographic expansion in our Subsea Productssegment; and• conversion of the Ocean Patriot to a dynamically positioned saturation diving vesseland completion of its saturation diving system in our Subsea Projects business.We expect our 2012 diluted earnings per share to be in the range of $2.45 to $2.65, ascompared to $2.16 in 2011. We anticipate continued international demand growth and amoderate rebound in overall activity in the U.S. Gulf of Mexico. Compared to 2011, in 2012 weare <strong>for</strong>ecasting an increase in ROV operating income as a result of a higher average fleet sizeand increased demand offshore West Africa and in the U.S. Gulf of Mexico.We use our ROVs in the offshore oil and gas industry to per<strong>for</strong>m a variety of underwater tasks,including drill support, installation and construction support, pipeline inspection and surveys andsubsea production facility inspection, repair and maintenance. The largest percentage of ourROVs has historically been used to provide drill support services.There<strong>for</strong>e, the number of floating drilling rigs on hire is a leading market indicator <strong>for</strong> thisbusiness. The following table shows average floating rigs under contract and our ROVutilization.2011 2010 2009Average number of floating rigs under contract 238 220 208ROV days on hire (in thousands) 73 69 69ROV utilization 77 % 75 % 79 %Demand <strong>for</strong> floating rigs is our primary driver of future growth prospects. According to industrydata published by ODS-Petrodata, at the end of 2011, there were 284 floating drilling rigs in theworld, with 260 of the rigs under contract and 69% of the rigs contracted through 2012. Sixtyeightadditional floating rigs were on order, with 45 scheduled to be delivered through 2013, and28 of these 68 have been contracted long-term, <strong>for</strong> an average term of approximately sevenyears. We estimate approximately 24 floating rigs will be placed in service during 2012, and wehave ROV contracts on eight of those. Competitors have the ROV contracts on nine rigs,leaving seven contract opportunities.In addition to floating rig demand, subsea tree completions are another leading indicator of thestrength of the deepwater market and the primary demand driver <strong>for</strong> our Subsea Products lines.According to industry data published by Quest Offshore Resources, Inc., there were less than600 subsea completions be<strong>for</strong>e 1990, approximately 1,100 in the decade of the 1990s,approximately 3,100 in the decade of the 2000s, and Quest <strong>for</strong>ecasts over 5,000 <strong>for</strong> the decadeof the 2010s. Quest also projects the global market <strong>for</strong> subsea tree orders is expected toincrease 58% in the 2011-2015 time period compared to the previous five years.2011 Annual Report 11
- Page 3 and 4: Financial Highlights($ in thousands
- Page 5 and 6: In December we secured a three-year
- Page 7: 2011 Financial SectionOceaneering I
- Page 10 and 11: Oceaneering Common StockOur common
- Page 14 and 15: Critical Accounting Policies and Es
- Page 16 and 17: We establish valuation allowances t
- Page 18 and 19: In 2009, we used $162 million in in
- Page 20 and 21: For 2011, our ROV revenue and opera
- Page 22 and 23: We earn equity income from our 50%
- Page 24 and 25: Controls and ProceduresDisclosure C
- Page 26 and 27: In our opinion, Oceaneering Interna
- Page 28 and 29: OCEANEERING INTERNATIONAL, INC. AND
- Page 30 and 31: OCEANEERING INTERNATIONAL, INC. AND
- Page 32 and 33: OCEANEERING INTERNATIONAL, INC. AND
- Page 34 and 35: for marine services equipment (such
- Page 36 and 37: segment and its Australian assets a
- Page 38 and 39: Revenue in Excess of Amounts Billed
- Page 40 and 41: elationship and, if it is, the type
- Page 42 and 43: December 31,(in thousands) 2011 201
- Page 44 and 45: in entities or jurisdictions that h
- Page 46 and 47: 4. SELECTED BALANCE SHEET AND INCOM
- Page 48 and 49: On January 6, 2012, we entered into
- Page 50 and 51: Financial Instruments and Risk Conc
- Page 52 and 53: The table that follows presents Rev
- Page 54 and 55: The following table presents Assets
- Page 56 and 57: Geographic Operating AreasThe follo
- Page 58 and 59: equirements. The Compensation Commi
- Page 60 and 61: in 2011, 2010 and 2009 were subject
- Page 62 and 63:
Forward-Looking StatementsAll state
- Page 64:
Oceaneering International, Inc.1191


