For 2011, our ROV revenue and operating income increased over 2010 from increased days onhire, as we had more systems available and had higher utilization due to increased internationaldemand. Our operating income margin decreased as a result of geographic mix, as ouraggregate international ROV operations have lower margins than our U.S. Gulf of Mexicooperations.For 2010, our ROV revenue and operating income increased 2% over 2009 from increasedrevenue per day-on-hire. Good cost controls helped us keep margin percentages flat despitelower utilization. We grew our ROV fleet size to 267 at December 31, 2011 from 260 atDecember 31, 2010 and 248 at December 31, 2009.We anticipate ROV operating income to increase in 2012 as a result of an increase in days onhire, with an increase in our fleet utilization to 80% or more, from increased demand offshoreWest Africa and in the U.S. Gulf of Mexico. We anticipate adding 20 to 25 vehicles in 2012 andretiring four to six, which should add to our days available and days on hire over 2011.Our Subsea Products operating income <strong>for</strong> 2011 increased over 2010 on better umbilical plantthroughput, higher installation and workover control system ("IWOCS") services, and growth indemand <strong>for</strong> our subsea hardware and tooling, partially due to our acquisition of NCA in March2011. Our operating margin percentage was lower due to product mix, with umbilicals being ahigher percentage of Subsea Products revenue in 2011.Our Subsea Products operating income and margin percentage <strong>for</strong> 2010 increased over 2009,due to manufacturing process improvements and cost reductions, improved umbilical plantthroughput, and higher demand <strong>for</strong> subsea field development hardware, ROV tooling rentalsand IWOCS services. Our 2009 operating income and margins were also adversely affected by$5.5 million of unexpected costs we incurred in the third quarter on two blowout preventercontrol systems.We anticipate our Subsea Products segment operating income in 2012 to be higher than in2011, as we expect increased tooling demand and throughput in our umbilical plants. OurSubsea Products backlog was $382 million at December 31, 2011, about the same level it wasat December 31, 2010.Our 2011 Subsea Projects revenue and operating income declined from 2010 due to lowerdemand <strong>for</strong> our shallow water diving and deepwater vessel services in the U.S. Gulf of Mexico.In 2011, we recorded a gain of $19.6 million on the sale of the Ocean Legend, a <strong>mobile</strong> offshoreproduction system.Our 2010 Subsea Projects revenue and operating income declined from 2009 due to lowerdemand <strong>for</strong> our services on hurricane damage-related repair projects and our phased exit of the<strong>mobile</strong> offshore production systems business. In 2010, we recorded a $5.2 million impairmentcharge to adjust the carrying value of our vessel, The Per<strong>for</strong>mer, to its fair value less estimatedcosts to sell. We completed the sale in 2010 <strong>for</strong> approximately the vessel's reduced carryingvalue.We anticipate our 2012 operating income <strong>for</strong> Subsea Projects to be higher than in 2011 on aninternational expansion of our deepwater vessel capabilities to work <strong>for</strong> BP plc offshore Angola,the addition of AGR FO's operations in Australia, and a gradual demand recovery in the U.S.Gulf of Mexico.Our Asset Integrity revenue and operating income were higher in 2011 than in 2010 on higherservice demand in Europe and Central Asia. Our Asset Integrity segment operating incomeresults in 2010 were similar to those in 2009. We expect that our Asset Integrity segmentrevenue and operating income will be higher in 2012, primarily as a result of our acquisition ofAGR FO in December 2011.18 <strong>Oceaneering</strong> International, Inc.
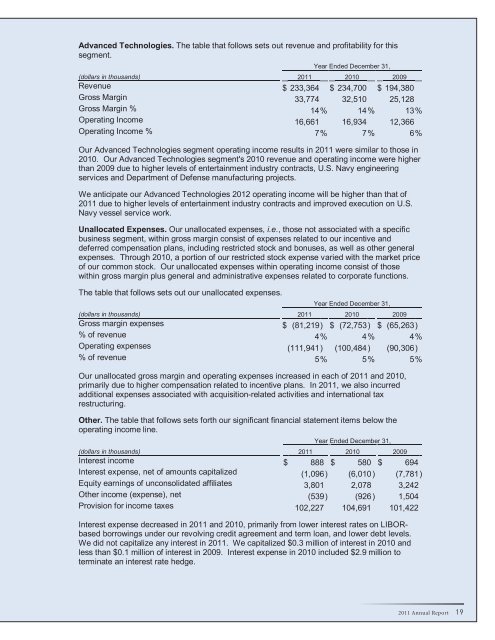
Advanced Technologies. The table that follows sets out revenue and profitability <strong>for</strong> thissegment.Year Ended December 31,(dollars in thousands) 2011 2010 2009Revenue $ 233,364 $ 234,700 $ 194,380Gross Margin 33,774 32,510 25,128Gross Margin % 14 % 14 % 13 %Operating Income 16,661 16,934 12,366Operating Income % 7 % 7 % 6 %Our Advanced Technologies segment operating income results in 2011 were similar to those in2010. Our Advanced Technologies segment's 2010 revenue and operating income were higherthan 2009 due to higher levels of entertainment industry contracts, U.S. Navy engineeringservices and Department of Defense manufacturing projects.We anticipate our Advanced Technologies 2012 operating income will be higher than that of2011 due to higher levels of entertainment industry contracts and improved execution on U.S.Navy vessel service work.Unallocated Expenses. Our unallocated expenses, i.e., those not associated with a specificbusiness segment, within gross margin consist of expenses related to our incentive anddeferred compensation plans, including restricted stock and bonuses, as well as other generalexpenses. Through 2010, a portion of our restricted stock expense varied with the market priceof our common stock. Our unallocated expenses within operating income consist of thosewithin gross margin plus general and administrative expenses related to corporate functions.The table that follows sets out our unallocated expenses.Year Ended December 31,(dollars in thousands) 2011 2010 2009Gross margin expenses $ (81,219) $ (72,753) $ (65,263)% of revenue 4 % 4 % 4 %Operating expenses (111,941 ) (100,484 ) (90,306)% of revenue 5 % 5 % 5 %Our unallocated gross margin and operating expenses increased in each of 2011 and 2010,primarily due to higher compensation related to incentive plans. In 2011, we also incurredadditional expenses associated with acquisition-related activities and international taxrestructuring.Other. The table that follows sets <strong>for</strong>th our significant financial statement items below theoperating income line.Year Ended December 31,(dollars in thousands) 2011 2010 2009Interest income $ 888 $ 580 $ 694Interest expense, net of amounts capitalized (1,096) (6,010 ) (7,781)Equity earnings of unconsolidated affiliates 3,801 2,078 3,242Other income (expense), net (539) (926 ) 1,504Provision <strong>for</strong> income taxes 102,227 104,691 101,422Interest expense decreased in 2011 and 2010, primarily from lower interest rates on LIBORbasedborrowings under our revolving credit agreement and term loan, and lower debt levels.We did not capitalize any interest in 2011. We capitalized $0.3 million of interest in 2010 andless than $0.1 million of interest in 2009. Interest expense in 2010 included $2.9 million toterminate an interest rate hedge.2011 Annual Report 19
- Page 3 and 4: Financial Highlights($ in thousands
- Page 5 and 6: In December we secured a three-year
- Page 7: 2011 Financial SectionOceaneering I
- Page 10 and 11: Oceaneering Common StockOur common
- Page 12 and 13: Management's Discussion and Analysi
- Page 14 and 15: Critical Accounting Policies and Es
- Page 16 and 17: We establish valuation allowances t
- Page 18 and 19: In 2009, we used $162 million in in
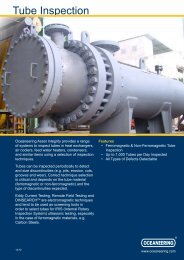
- Page 22 and 23: We earn equity income from our 50%
- Page 24 and 25: Controls and ProceduresDisclosure C
- Page 26 and 27: In our opinion, Oceaneering Interna
- Page 28 and 29: OCEANEERING INTERNATIONAL, INC. AND
- Page 30 and 31: OCEANEERING INTERNATIONAL, INC. AND
- Page 32 and 33: OCEANEERING INTERNATIONAL, INC. AND
- Page 34 and 35: for marine services equipment (such
- Page 36 and 37: segment and its Australian assets a
- Page 38 and 39: Revenue in Excess of Amounts Billed
- Page 40 and 41: elationship and, if it is, the type
- Page 42 and 43: December 31,(in thousands) 2011 201
- Page 44 and 45: in entities or jurisdictions that h
- Page 46 and 47: 4. SELECTED BALANCE SHEET AND INCOM
- Page 48 and 49: On January 6, 2012, we entered into
- Page 50 and 51: Financial Instruments and Risk Conc
- Page 52 and 53: The table that follows presents Rev
- Page 54 and 55: The following table presents Assets
- Page 56 and 57: Geographic Operating AreasThe follo
- Page 58 and 59: equirements. The Compensation Commi
- Page 60 and 61: in 2011, 2010 and 2009 were subject
- Page 62 and 63: Forward-Looking StatementsAll state
- Page 64: Oceaneering International, Inc.1191