PDF Download Link (best for mobile devices) - Oceaneering
PDF Download Link (best for mobile devices) - Oceaneering
PDF Download Link (best for mobile devices) - Oceaneering
- No tags were found...

Create successful ePaper yourself
Turn your PDF publications into a flip-book with our unique Google optimized e-Paper software.
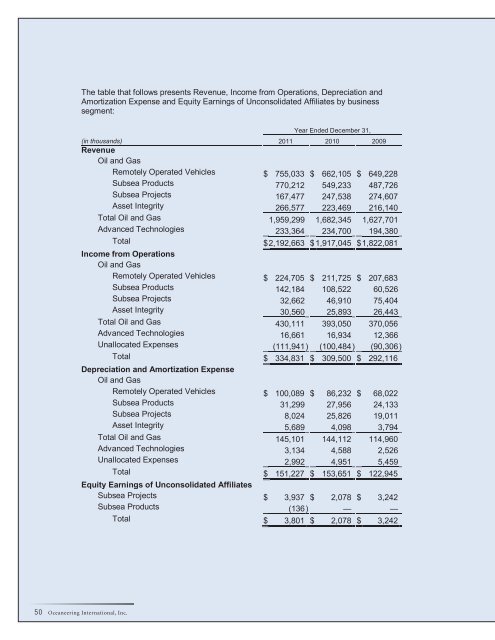
The table that follows presents Revenue, Income from Operations, Depreciation andAmortization Expense and Equity Earnings of Unconsolidated Affiliates by businesssegment:Year Ended December 31,(in thousands) 2011 2010 2009RevenueOil and GasRemotely Operated Vehicles $ 755,033 $ 662,105 $ 649,228Subsea Products 770,212 549,233 487,726Subsea Projects 167,477 247,538 274,607Asset Integrity 266,577 223,469 216,140Total Oil and Gas 1,959,299 1,682,345 1,627,701Advanced Technologies 233,364 234,700 194,380Total $ 2,192,663 $ 1,917,045 $ 1,822,081Income from OperationsOil and GasRemotely Operated Vehicles $ 224,705 $ 211,725 $ 207,683Subsea Products 142,184 108,522 60,526Subsea Projects 32,662 46,910 75,404Asset Integrity 30,560 25,893 26,443Total Oil and Gas 430,111 393,050 370,056Advanced Technologies 16,661 16,934 12,366Unallocated Expenses (111,941) (100,484) (90,306)Total $ 334,831 $ 309,500 $ 292,116Depreciation and Amortization ExpenseOil and GasRemotely Operated Vehicles $ 100,089 $ 86,232 $ 68,022Subsea Products 31,299 27,956 24,133Subsea Projects 8,024 25,826 19,011Asset Integrity 5,689 4,098 3,794Total Oil and Gas 145,101 144,112 114,960Advanced Technologies 3,134 4,588 2,526Unallocated Expenses 2,992 4,951 5,459Total $ 151,227 $ 153,651 $ 122,945Equity Earnings of Unconsolidated AffiliatesSubsea Projects $ 3,937 $ 2,078 $ 3,242Subsea Products (136) — —Total $ 3,801 $ 2,078 $ 3,24250 <strong>Oceaneering</strong> International, Inc.