Create successful ePaper yourself
Turn your PDF publications into a flip-book with our unique Google optimized e-Paper software.
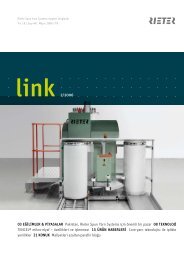
Historical sales<br />
Net sales (2006 – 2010) Comments<br />
CHF MM<br />
2,500<br />
2,000<br />
1,500<br />
1,000<br />
500<br />
0<br />
2,115<br />
FAK/BMK 2010 March 2011<br />
2,295<br />
(1) (1)<br />
1,960<br />
149<br />
45<br />
514<br />
1,222<br />
128<br />
52<br />
403<br />
794<br />
150<br />
77<br />
549<br />
897<br />
2006A 2007A 2008A 2009A 2010A<br />
BG Europe BG North America BG Asia BG SAMEA Group<br />
(1) Based on <strong>Autoneum</strong>’s internal non-audited data<br />
(2) Total net sales for the <strong>Autoneum</strong> Group include “Other activities” (sales generated by <strong>Autoneum</strong>’s tooling activities and R&T activitiesand<br />
sales generated by the IDEA Group, which was sold in June 2010) in addition to business group sales<br />
(2)<br />
1,387<br />
+21%<br />
(2)<br />
1,678<br />
(2)<br />
<strong>Autoneum</strong><br />
• In 2008 through 2009, steep decline of vehicle<br />
production in <strong>Autoneum</strong>’s main markets across<br />
most customers<br />
• In H2 2009 and 2010, <strong>Autoneum</strong> benefited from<br />
improving market conditions<br />
• Organic growth in all regions thanks to a broad<br />
global customer and product portfolio set-up<br />
• Strongest revenue recovery in North and<br />
South America<br />
• Strong growth in Asia driven by new orders and<br />
recent opening of new facilities in China and<br />
India<br />
• In Europe volume stabilized and started to<br />
recover in 2010<br />
• In local currency, growth 2009/2010 would<br />
equal +25%<br />
69