

Sweating the Small Stuff: Does data cleaning and testing ... - Frontiers
Sweating the Small Stuff: Does data cleaning and testing ... - Frontiers
Sweating the Small Stuff: Does data cleaning and testing ... - Frontiers
- No tags were found...

Create successful ePaper yourself
Turn your PDF publications into a flip-book with our unique Google optimized e-Paper software.
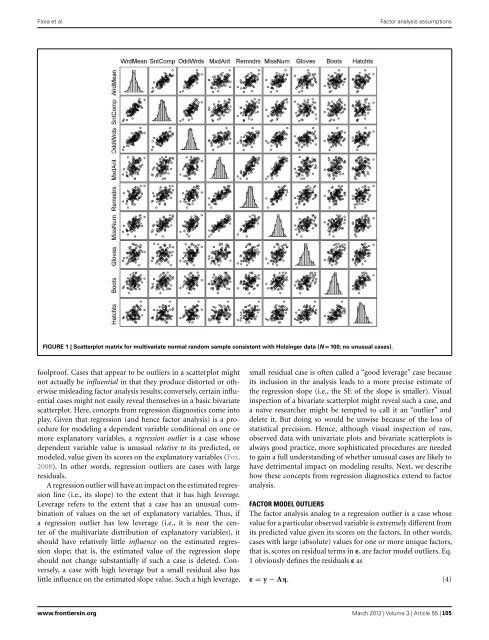
Flora et al.Factor analysis assumptionsFIGURE 1 | Scatterplot matrix for multivariate normal r<strong>and</strong>om sample consistent with Holzinger <strong>data</strong> (N = 100; no unusual cases).foolproof. Cases that appear to be outliers in a scatterplot mightnot actually be influential in that <strong>the</strong>y produce distorted or o<strong>the</strong>rwisemisleading factor analysis results; conversely, certain influentialcases might not easily reveal <strong>the</strong>mselves in a basic bivariatescatterplot. Here, concepts from regression diagnostics come intoplay. Given that regression (<strong>and</strong> hence factor analysis) is a procedurefor modeling a dependent variable conditional on one ormore explanatory variables, a regression outlier is a case whosedependent variable value is unusual relative to its predicted, ormodeled, value given its scores on <strong>the</strong> explanatory variables (Fox,2008). In o<strong>the</strong>r words, regression outliers are cases with largeresiduals.A regression outlier will have an impact on <strong>the</strong> estimated regressionline (i.e., its slope) to <strong>the</strong> extent that it has high leverage.Leverage refers to <strong>the</strong> extent that a case has an unusual combinationof values on <strong>the</strong> set of explanatory variables. Thus, ifa regression outlier has low leverage (i.e., it is near <strong>the</strong> centerof <strong>the</strong> multivariate distribution of explanatory variables), itshould have relatively little influence on <strong>the</strong> estimated regressionslope; that is, <strong>the</strong> estimated value of <strong>the</strong> regression slopeshould not change substantially if such a case is deleted. Conversely,a case with high leverage but a small residual also haslittle influence on <strong>the</strong> estimated slope value. Such a high leverage,small residual case is often called a “good leverage” case becauseits inclusion in <strong>the</strong> analysis leads to a more precise estimate of<strong>the</strong> regression slope (i.e., <strong>the</strong> SE of <strong>the</strong> slope is smaller). Visualinspection of a bivariate scatterplot might reveal such a case, <strong>and</strong>a naïve researcher might be tempted to call it an “outlier” <strong>and</strong>delete it. But doing so would be unwise because of <strong>the</strong> loss ofstatistical precision. Hence, although visual inspection of raw,observed <strong>data</strong> with univariate plots <strong>and</strong> bivariate scatterplots isalways good practice, more sophisticated procedures are neededto gain a full underst<strong>and</strong>ing of whe<strong>the</strong>r unusual cases are likely tohave detrimental impact on modeling results. Next, we describehow <strong>the</strong>se concepts from regression diagnostics extend to factoranalysis.FACTOR MODEL OUTLIERSThe factor analysis analog to a regression outlier is a case whosevalue for a particular observed variable is extremely different fromits predicted value given its scores on <strong>the</strong> factors. In o<strong>the</strong>r words,cases with large (absolute) values for one or more unique factors,that is, scores on residual terms in ε, are factor model outliers. Eq.1 obviously defines <strong>the</strong> residuals ε asε = y − Λη. (4)www.frontiersin.org March 2012 | Volume 3 | Article 55 | 105


