

Sweating the Small Stuff: Does data cleaning and testing ... - Frontiers
Sweating the Small Stuff: Does data cleaning and testing ... - Frontiers
Sweating the Small Stuff: Does data cleaning and testing ... - Frontiers
- No tags were found...

You also want an ePaper? Increase the reach of your titles
YUMPU automatically turns print PDFs into web optimized ePapers that Google loves.
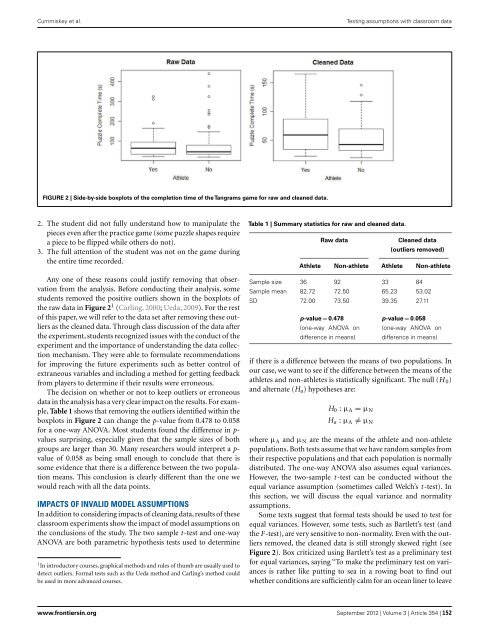
Cummiskey et al.Testing assumptions with classroom <strong>data</strong>FIGURE 2 | Side-by-side boxplots of <strong>the</strong> completion time of <strong>the</strong> Tangrams game for raw <strong>and</strong> cleaned <strong>data</strong>.2. The student did not fully underst<strong>and</strong> how to manipulate <strong>the</strong>pieces even after <strong>the</strong> practice game (some puzzle shapes requirea piece to be flipped while o<strong>the</strong>rs do not).3. The full attention of <strong>the</strong> student was not on <strong>the</strong> game during<strong>the</strong> entire time recorded.Any one of <strong>the</strong>se reasons could justify removing that observationfrom <strong>the</strong> analysis. Before conducting <strong>the</strong>ir analysis, somestudents removed <strong>the</strong> positive outliers shown in <strong>the</strong> boxplots of<strong>the</strong> raw <strong>data</strong> in Figure 2 1 (Carling, 2000; Ueda, 2009). For <strong>the</strong> restof this paper, we will refer to <strong>the</strong> <strong>data</strong> set after removing <strong>the</strong>se outliersas <strong>the</strong> cleaned <strong>data</strong>. Through class discussion of <strong>the</strong> <strong>data</strong> after<strong>the</strong> experiment, students recognized issues with <strong>the</strong> conduct of <strong>the</strong>experiment <strong>and</strong> <strong>the</strong> importance of underst<strong>and</strong>ing <strong>the</strong> <strong>data</strong> collectionmechanism. They were able to formulate recommendationsfor improving <strong>the</strong> future experiments such as better control ofextraneous variables <strong>and</strong> including a method for getting feedbackfrom players to determine if <strong>the</strong>ir results were erroneous.The decision on whe<strong>the</strong>r or not to keep outliers or erroneous<strong>data</strong> in <strong>the</strong> analysis has a very clear impact on <strong>the</strong> results. For example,Table 1 shows that removing <strong>the</strong> outliers identified within <strong>the</strong>boxplots in Figure 2 can change <strong>the</strong> p-value from 0.478 to 0.058for a one-way ANOVA. Most students found <strong>the</strong> difference in p-values surprising, especially given that <strong>the</strong> sample sizes of bothgroups are larger than 30. Many researchers would interpret a p-value of 0.058 as being small enough to conclude that <strong>the</strong>re issome evidence that <strong>the</strong>re is a difference between <strong>the</strong> two populationmeans. This conclusion is clearly different than <strong>the</strong> one wewould reach with all <strong>the</strong> <strong>data</strong> points.IMPACTS OF INVALID MODEL ASSUMPTIONSIn addition to considering impacts of <strong>cleaning</strong> <strong>data</strong>, results of <strong>the</strong>seclassroom experiments show <strong>the</strong> impact of model assumptions on<strong>the</strong> conclusions of <strong>the</strong> study. The two sample t -test <strong>and</strong> one-wayANOVA are both parametric hypo<strong>the</strong>sis tests used to determine1 In introductory courses, graphical methods <strong>and</strong> rules of thumb are usually used todetect outliers. Formal tests such as <strong>the</strong> Ueda method <strong>and</strong> Carling’s method couldbe used in more advanced courses.Table 1 | Summary statistics for raw <strong>and</strong> cleaned <strong>data</strong>.Raw <strong>data</strong>Cleaned <strong>data</strong>(outliers removed)Athlete Non-athlete Athlete Non-athleteSample size 36 92 33 84Sample mean 82.72 72.50 65.23 53.02SD 72.00 73.50 39.35 27.11p-value = 0.478(one-way ANOVA ondifference in means)p-value = 0.058(one-way ANOVA ondifference in means)if <strong>the</strong>re is a difference between <strong>the</strong> means of two populations. Inour case, we want to see if <strong>the</strong> difference between <strong>the</strong> means of <strong>the</strong>athletes <strong>and</strong> non-athletes is statistically significant. The null (H 0 )<strong>and</strong> alternate (H a ) hypo<strong>the</strong>ses are:H 0 : µ A = µ NH a : µ A ̸= µ Nwhere µ A <strong>and</strong> µ N are <strong>the</strong> means of <strong>the</strong> athlete <strong>and</strong> non-athletepopulations. Both tests assume that we have r<strong>and</strong>om samples from<strong>the</strong>ir respective populations <strong>and</strong> that each population is normallydistributed. The one-way ANOVA also assumes equal variances.However, <strong>the</strong> two-sample t -test can be conducted without <strong>the</strong>equal variance assumption (sometimes called Welch’s t -test). Inthis section, we will discuss <strong>the</strong> equal variance <strong>and</strong> normalityassumptions.Some texts suggest that formal tests should be used to test forequal variances. However, some tests, such as Bartlett’s test (<strong>and</strong><strong>the</strong> F-test), are very sensitive to non-normality. Even with <strong>the</strong> outliersremoved, <strong>the</strong> cleaned <strong>data</strong> is still strongly skewed right (seeFigure 2). Box criticized using Bartlett’s test as a preliminary testfor equal variances, saying “To make <strong>the</strong> preliminary test on variancesis ra<strong>the</strong>r like putting to sea in a rowing boat to find outwhe<strong>the</strong>r conditions are sufficiently calm for an ocean liner to leavewww.frontiersin.org September 2012 | Volume 3 | Article 354 | 152


