MINI REVIEW ARTICLEpublished: 28 August 2012doi: 10.3389/fpsyg.2012.00322Statistical assumptions of substantive analyses across <strong>the</strong>general linear model: a mini-reviewKim F. Nimon*Learning Technologies, University North Texas, Denton, TX, USAEdited by:Jason W. Osborne, Old DominionUniversity, USAReviewed by:Anne C. Black, Yale University Schoolof Medicine, USAMegan Welsh, University ofConnecticut, USACherng-Jyh Yen, Old DominionUniversity, USA*Correspondence:Kim F. Nimon, Learning Technologies,University North Texas, 3940 NorthElm Street, G150 Denton, 76207 TX,USA.e-mail: kim.nimon@gmail.comThe validity of inferences drawn from statistical test results depends on how well <strong>data</strong>meet associated assumptions.Yet, research (e.g., Hoekstra et al., 2012) indicates that suchassumptions are rarely reported in literature <strong>and</strong> that some researchers might be unfamiliarwith <strong>the</strong> techniques <strong>and</strong> remedies that are pertinent to <strong>the</strong> statistical tests <strong>the</strong>y conduct.This article seeks to support researchers by concisely reviewing key statistical assumptionsassociated with substantive statistical tests across <strong>the</strong> general linear model. Additionally,<strong>the</strong> article reviews techniques to check for statistical assumptions <strong>and</strong> identifies remedies<strong>and</strong> problems if <strong>data</strong> do not meet <strong>the</strong> necessary assumptions.Keywords: assumptions, robustness, analyzing <strong>data</strong>, normality, homogeneityThe degree to which valid inferences may be drawn from <strong>the</strong>results of inferential statistics depends upon <strong>the</strong> sampling technique<strong>and</strong> <strong>the</strong> characteristics of population <strong>data</strong>. This dependencystems from <strong>the</strong> fact that statistical analyses assume that sample(s)<strong>and</strong> population(s) meet certain conditions. These conditions arecalled statistical assumptions. If violations of statistical assumptionsare not appropriately addressed, results may be interpretedincorrectly. In particular, when statistical assumptions are violated,<strong>the</strong> probability of a test statistic may be inaccurate, distorting TypeI or Type II error rates.This article focuses on <strong>the</strong> assumptions associated with substantivestatistical analyses across <strong>the</strong> general linear model (GLM),as research indicates <strong>the</strong>y are reported with more frequencyin educational <strong>and</strong> psychological research than analyses focusingon measurement (cf. Kieffer et al., 2001; Zientek et al.,2008). This review is organized around Table 1, which relateskey statistical assumptions to associated analyses <strong>and</strong> classifies<strong>the</strong>m into <strong>the</strong> following categories: r<strong>and</strong>omization, independence,measurement, normality, linearity, <strong>and</strong> variance. Note that <strong>the</strong>assumptions of independence, measurement, normality, linearity,<strong>and</strong> variance apply to population <strong>data</strong> <strong>and</strong> are tested byexamining sample <strong>data</strong> <strong>and</strong> using test statistics to draw inferencesabout <strong>the</strong> population(s) from which <strong>the</strong> sample(s) wereselected.RANDOMIZATIONA basic statistical assumption across <strong>the</strong> GLM is that sample <strong>data</strong>are drawn r<strong>and</strong>omly from <strong>the</strong> population. However, much socialscience research is based on unrepresentative samples (Thompson,2006) <strong>and</strong> many quantitative researchers select a samplethat suits <strong>the</strong> purpose of <strong>the</strong> study <strong>and</strong> that is convenient (Gallet al., 2007). When <strong>the</strong> assumption of r<strong>and</strong>om sampling is notmet, inferences to <strong>the</strong> population become difficult. In this case,researchers should describe <strong>the</strong> sample <strong>and</strong> population in sufficientdetail to justify that <strong>the</strong> sample was at least representative of<strong>the</strong> intended population (Wilkinson <strong>and</strong> APA Task Force on StatisticalInference, 1999). If such a justification is not made, readersare left to <strong>the</strong>ir own interpretation as to <strong>the</strong> generalizability of <strong>the</strong>results.INDEPENDENCEAcross GLM analyses, it is assumed that observations are independentof each o<strong>the</strong>r. In quantitative research, <strong>data</strong> often do notmeet <strong>the</strong> independence assumption. The simplest case of nonindependent<strong>data</strong> is paired sample or repeated measures <strong>data</strong>. In<strong>the</strong>se cases, only pairs of observations (or sets of repeated <strong>data</strong>) canbe independent because <strong>the</strong> structure of <strong>the</strong> <strong>data</strong> is by design paired(or repeated). More complex <strong>data</strong> structures that do not meet <strong>the</strong>assumption of independence include nested <strong>data</strong> (e.g., employeeswithin teams <strong>and</strong> teams within departments) <strong>and</strong> cross-classified<strong>data</strong> (e.g., students within schools <strong>and</strong> neighborhoods).When <strong>data</strong> do not meet <strong>the</strong> assumption of independence, <strong>the</strong>accuracy of <strong>the</strong> test statistics (e.g., t, F, χ 2 ) resulting from a GLManalysis depends on <strong>the</strong> test conducted. For <strong>data</strong> that is paired(e.g., pretest-posttest, parent-child), paired samples t test is anappropriate statistical analysis as long as <strong>the</strong> pairs of observationsare independent <strong>and</strong> all o<strong>the</strong>r statistical assumptions (see Table 1)are met. Similarly, for repeated measures <strong>data</strong>, repeated measuresANOVA is an appropriate statistical analysis as long as sets ofrepeated measures <strong>data</strong> are independent <strong>and</strong> all o<strong>the</strong>r statisticalassumptions (see Table 1) are met. For repeated measures <strong>and</strong>/ornon-repeated measures <strong>data</strong> that are nested or cross-classified,multilevel modeling (MLM) is an appropriate statistical analyticstrategy because it models non-independence. Statistical tests thatdo not model <strong>the</strong> nested or cross-classified structure of <strong>data</strong> willlead to a higher probability of rejecting <strong>the</strong> null hypo<strong>the</strong>ses (i.e.,www.frontiersin.org August 2012 | Volume 3 | Article 322 | 71
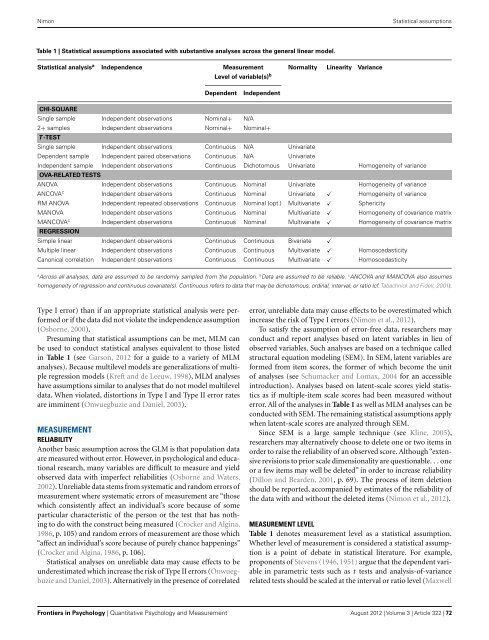
NimonStatistical assumptionsTable 1 | Statistical assumptions associated with substantive analyses across <strong>the</strong> general linear model.Statistical analysis a Independence Measurement Normality Linearity VarianceLevel of variable(s) bDependentIndependentCHI-SQUARESingle sample Independent observations Nominal+ N/A2+ samples Independent observations Nominal+ Nominal+T -TESTSingle sample Independent observations Continuous N/A UnivariateDependent sample Independent paired observations Continuous N/A UnivariateIndependent sample Independent observations Continuous Dichotomous Univariate Homogeneity of varianceOVA-RELATED TESTSANOVA Independent observations Continuous Nominal Univariate Homogeneity of varianceANCOVA c Independent observations Continuous Nominal Univariate ̌ Homogeneity of varianceRM ANOVA Independent repeated observations Continuous Nominal (opt.) Multivariate ̌ SphericityMANOVA Independent observations Continuous Nominal Multivariate ̌ Homogeneity of covariance matrixMANCOVA c Independent observations Continuous Nominal Multivariate ̌ Homogeneity of covariance matrixREGRESSIONSimple linear Independent observations Continuous Continuous Bivariate ̌Multiple linear Independent observations Continuous Continuous Multivariate ̌ HomoscedasticityCanonical correlation Independent observations Continuous Continuous Multivariate ̌ HomoscedasticityaAcross all analyses, <strong>data</strong> are assumed to be r<strong>and</strong>omly sampled from <strong>the</strong> population. b Data are assumed to be reliable. c ANCOVA <strong>and</strong> MANCOVA also assumeshomogeneity of regression <strong>and</strong> continuous covariate(s). Continuous refers to <strong>data</strong> that may be dichotomous, ordinal, interval, or ratio (cf. Tabachnick <strong>and</strong> Fidell, 2001).Type I error) than if an appropriate statistical analysis were performedor if <strong>the</strong> <strong>data</strong> did not violate <strong>the</strong> independence assumption(Osborne, 2000).Presuming that statistical assumptions can be met, MLM canbe used to conduct statistical analyses equivalent to those listedin Table 1 (see Garson, 2012 for a guide to a variety of MLManalyses). Because multilevel models are generalizations of multipleregression models (Kreft <strong>and</strong> de Leeuw, 1998), MLM analyseshave assumptions similar to analyses that do not model multilevel<strong>data</strong>. When violated, distortions in Type I <strong>and</strong> Type II error ratesare imminent (Onwuegbuzie <strong>and</strong> Daniel, 2003).MEASUREMENTRELIABILITYAno<strong>the</strong>r basic assumption across <strong>the</strong> GLM is that population <strong>data</strong>are measured without error. However, in psychological <strong>and</strong> educationalresearch, many variables are difficult to measure <strong>and</strong> yieldobserved <strong>data</strong> with imperfect reliabilities (Osborne <strong>and</strong> Waters,2002). Unreliable <strong>data</strong> stems from systematic <strong>and</strong> r<strong>and</strong>om errors ofmeasurement where systematic errors of measurement are “thosewhich consistently affect an individual’s score because of someparticular characteristic of <strong>the</strong> person or <strong>the</strong> test that has nothingto do with <strong>the</strong> construct being measured (Crocker <strong>and</strong> Algina,1986, p. 105) <strong>and</strong> r<strong>and</strong>om errors of measurement are those which“affect an individual’s score because of purely chance happenings”(Crocker <strong>and</strong> Algina, 1986, p. 106).Statistical analyses on unreliable <strong>data</strong> may cause effects to beunderestimated which increase <strong>the</strong> risk of Type II errors (Onwuegbuzie<strong>and</strong> Daniel, 2003). Alternatively in <strong>the</strong> presence of correlatederror, unreliable <strong>data</strong> may cause effects to be overestimated whichincrease <strong>the</strong> risk of Type I errors (Nimon et al., 2012).To satisfy <strong>the</strong> assumption of error-free <strong>data</strong>, researchers mayconduct <strong>and</strong> report analyses based on latent variables in lieu ofobserved variables. Such analyses are based on a technique calledstructural equation modeling (SEM). In SEM, latent variables areformed from item scores, <strong>the</strong> former of which become <strong>the</strong> unitof analyses (see Schumacker <strong>and</strong> Lomax, 2004 for an accessibleintroduction). Analyses based on latent-scale scores yield statisticsas if multiple-item scale scores had been measured withouterror. All of <strong>the</strong> analyses in Table 1 as well as MLM analyses can beconducted with SEM. The remaining statistical assumptions applywhen latent-scale scores are analyzed through SEM.Since SEM is a large sample technique (see Kline, 2005),researchers may alternatively choose to delete one or two items inorder to raise <strong>the</strong> reliability of an observed score. Although “extensiverevisions to prior scale dimensionality are questionable. . . oneor a few items may well be deleted” in order to increase reliability(Dillon <strong>and</strong> Bearden, 2001, p. 69). The process of item deletionshould be reported, accompanied by estimates of <strong>the</strong> reliability of<strong>the</strong> <strong>data</strong> with <strong>and</strong> without <strong>the</strong> deleted items (Nimon et al., 2012).MEASUREMENT LEVELTable 1 denotes measurement level as a statistical assumption.Whe<strong>the</strong>r level of measurement is considered a statistical assumptionis a point of debate in statistical literature. For example,proponents of Stevens (1946, 1951) argue that <strong>the</strong> dependent variablein parametric tests such as t tests <strong>and</strong> analysis-of-variancerelated tests should be scaled at <strong>the</strong> interval or ratio level (Maxwell<strong>Frontiers</strong> in Psychology | Quantitative Psychology <strong>and</strong> Measurement August 2012 | Volume 3 | Article 322 | 72