Hoekstra et al.Why assumptions are seldom checkedchecking for <strong>the</strong> assumption, provided that <strong>the</strong> assessment wasappropriate for <strong>the</strong> technique at h<strong>and</strong>. A correct check for <strong>the</strong>assumption of normality was recorded if, for <strong>the</strong> t-test <strong>and</strong>ANOVA, a graphical representation of <strong>the</strong> different groups wasrequested, except when <strong>the</strong> graph was used only to detect outliers.Merely looking at <strong>the</strong> numbers, without making a visualrepresentation was considered insufficient. For regression analysis,making a plot of <strong>the</strong> residuals was considered to be a correctcheck of <strong>the</strong> assumption of normality. Deciding whe<strong>the</strong>r this wasdone explicitly was based on whe<strong>the</strong>r <strong>the</strong> participant made anyreference to normality when thinking aloud. A second optionwas to make a QQ- or PP-plot of <strong>the</strong> residuals. Selecting <strong>the</strong>Kolmogorov–Smirnov test or <strong>the</strong> Shapiro–Wilk test within SPSSwas considered checking for <strong>the</strong> assumption of normality using apreliminary test.Three ways of checking for <strong>the</strong> assumption of homogeneity ofvariance for <strong>the</strong> t-test <strong>and</strong> ANOVA were considered adequate. Thefirst was to make a graphical representation of <strong>the</strong> <strong>data</strong> in such away that difference in variance between <strong>the</strong> groups was visible (e.g.,boxplots or scatter plots, provided that <strong>the</strong>y are given per group).A second way was to make an explicit reference to <strong>the</strong> varianceof <strong>the</strong> groups. A final possibility was to compare st<strong>and</strong>ard deviationsof <strong>the</strong> groups in <strong>the</strong> output, with or without making useof a rule of thumb to discriminate between violations <strong>and</strong> nonviolations.For regression analysis, a scatter plot or a residual plotwas considered necessary to check <strong>the</strong> assumption of homogeneityof variance. Although <strong>the</strong> assumption of homogeneity of varianceassumes equality of <strong>the</strong> population variations, an explicit referenceto <strong>the</strong> population was not required. The preliminary tests that wererecorded included Levene’s test, <strong>the</strong> F-ratio test, Bartlett’s test, <strong>and</strong><strong>the</strong> Brown–Forsy<strong>the</strong> test.The frequency of using preliminary tests was reported separatelyfrom o<strong>the</strong>r ways of checking for assumptions. Although<strong>the</strong> use of preliminary tests is often considered an inappropriatemethod for checking assumptions, <strong>the</strong>ir use does show awarenessof <strong>the</strong> existence of <strong>the</strong> assumption. Occurrences of checking forirrelevant assumptions, such as equal group sizes for <strong>the</strong> t-test, ornormality of all scores for one variable (instead of checking fornormality per group) for all three techniques were also counted,but scored as incorrectly checking for an assumption.QuestionnaireThe questionnaire addressed four explanations for why anassumption was not checked: (1) Unfamiliarity with <strong>the</strong> assumption,(2) Unfamiliarity with how to check <strong>the</strong> assumptions, (3)Violation of <strong>the</strong> assumption not being regarded problematic, <strong>and</strong>(4) Unfamiliarity with a remedy against a violation of <strong>the</strong> assumption.Each of <strong>the</strong>se explanations was operationalized before <strong>the</strong>questionnaires were analyzed. The experimenter was present duringquestionnaire administration to stimulate <strong>the</strong> participants toanswer more extensively, if necessary, or ask <strong>the</strong>m to reformulate<strong>the</strong>ir answer when <strong>the</strong>y seemed to have misread <strong>the</strong> question.Unfamiliarity with <strong>the</strong> assumptions. Participants were asked towrite down <strong>the</strong> assumptions <strong>the</strong>y thought it was necessary to checkfor each of <strong>the</strong> three statistical techniques used in <strong>the</strong> study. Simplymentioning <strong>the</strong> assumption of normality or homogeneity ofvariance was scored as being familiar with <strong>the</strong> assumption, evenif <strong>the</strong> participants did not specify what, exactly, was requiredto follow a normal distribution or which variances were supposedto be equal. Explaining <strong>the</strong> assumptions without explicitlymentioning <strong>the</strong>m was also scored as being familiar with thisassumption.Unfamiliarity with how to check <strong>the</strong> assumptions. Participantswere asked if <strong>the</strong>y could think of a way to investigate whe<strong>the</strong>r<strong>the</strong>re was a violation of each of <strong>the</strong> two assumptions (normality<strong>and</strong> homogeneity of variance) for t-tests, ANOVA <strong>and</strong> regression,respectively. Thus, <strong>the</strong> assumptions per technique were explicitlygiven, whe<strong>the</strong>r or not <strong>the</strong>y had been correctly reported in answerto <strong>the</strong> previous question. For normality, specifying how to visualize<strong>the</strong> <strong>data</strong> in such a way that a possible violation was visible wascategorized as a correct way of checking for assumption violations(for example: making a QQ-plot, or making a histogram), evenwhen no fur<strong>the</strong>r information was given about how to make such avisualization. Mentioning a measure of or a test for normality wasalso considered correct. For studying homogeneity of variance,rules of thumb or tests, such as Levene’s test for <strong>testing</strong> equalityof variances, were categorized as a correct way of checking thisassumption, <strong>and</strong> <strong>the</strong> same holds for eyeballing visual representationsfrom which variances could be deduced. Note that <strong>the</strong> criteriafor a correct check are lenient, since <strong>the</strong>y include preliminary teststhat are usually considered inappropriate.Violation of <strong>the</strong> assumption not being regarded problematic.For techniques for which it has been shown that <strong>the</strong>y are robustagainst certain assumption violations, it can be argued that itmakes sense not to check for <strong>the</strong>se assumptions, because <strong>the</strong>outcome of this checking process would not influence <strong>the</strong> interpretationof <strong>the</strong> <strong>data</strong> anyway. To study this explanation, participantswere asked per assumption <strong>and</strong> for <strong>the</strong> three techniques whe<strong>the</strong>r<strong>the</strong>y considered a possible violation to be influential. Afterward,<strong>the</strong> answers that indicated that this influence was small or absentwere scored as satisfying <strong>the</strong> criteria for this explanation.Unfamiliarity with a remedy against a violation of an assumption.One could imagine that a possible violation of assumptionsis not checked because no remedy for such violations is known.Participants were thus asked to note remedies for possible violationsof normality <strong>and</strong> homogeneity of variance for each of <strong>the</strong>three statistical analysis techniques. Correct remedies were definedas transforming <strong>the</strong> <strong>data</strong> (it was not required that participantsspecify which transformation), using a different technique (e.g., anon-parametric technique when <strong>the</strong> assumption of normality hasbeen violated) <strong>and</strong> increasing <strong>the</strong> sample size.DATA ANALYSISAll results are presented as percentages of <strong>the</strong> total number of participantsor of <strong>the</strong> total number of analyzed <strong>data</strong> sets, dependingon <strong>the</strong> specific research question. Confidence intervals (CIs) aregiven, but should be interpreted cautiously because <strong>the</strong> samplecannot be regarded as being completely r<strong>and</strong>om. The CIs for percentageswere calculated by <strong>the</strong> so-called Score CIs (Wilson, 1927).All CIs are 95% CIs.<strong>Frontiers</strong> in Psychology | Quantitative Psychology <strong>and</strong> Measurement May 2012 | Volume 3 | Article 137 |11
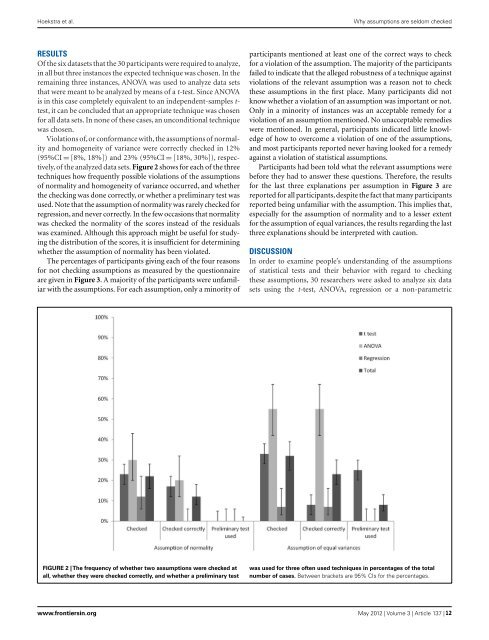
Hoekstra et al.Why assumptions are seldom checkedRESULTSOf <strong>the</strong> six <strong>data</strong>sets that <strong>the</strong> 30 participants were required to analyze,in all but three instances <strong>the</strong> expected technique was chosen. In <strong>the</strong>remaining three instances, ANOVA was used to analyze <strong>data</strong> setsthat were meant to be analyzed by means of a t-test. Since ANOVAis in this case completely equivalent to an independent-samples t-test, it can be concluded that an appropriate technique was chosenfor all <strong>data</strong> sets. In none of <strong>the</strong>se cases, an unconditional techniquewas chosen.Violations of,or conformance with,<strong>the</strong> assumptions of normality<strong>and</strong> homogeneity of variance were correctly checked in 12%(95%CI = [8%, 18%]) <strong>and</strong> 23% (95%CI = [18%, 30%]), respectively,of <strong>the</strong> analyzed <strong>data</strong> sets. Figure 2 shows for each of <strong>the</strong> threetechniques how frequently possible violations of <strong>the</strong> assumptionsof normality <strong>and</strong> homogeneity of variance occurred, <strong>and</strong> whe<strong>the</strong>r<strong>the</strong> checking was done correctly, or whe<strong>the</strong>r a preliminary test wasused. Note that <strong>the</strong> assumption of normality was rarely checked forregression, <strong>and</strong> never correctly. In <strong>the</strong> few occasions that normalitywas checked <strong>the</strong> normality of <strong>the</strong> scores instead of <strong>the</strong> residualswas examined. Although this approach might be useful for studying<strong>the</strong> distribution of <strong>the</strong> scores, it is insufficient for determiningwhe<strong>the</strong>r <strong>the</strong> assumption of normality has been violated.The percentages of participants giving each of <strong>the</strong> four reasonsfor not checking assumptions as measured by <strong>the</strong> questionnaireare given in Figure 3. A majority of <strong>the</strong> participants were unfamiliarwith <strong>the</strong> assumptions. For each assumption, only a minority ofparticipants mentioned at least one of <strong>the</strong> correct ways to checkfor a violation of <strong>the</strong> assumption. The majority of <strong>the</strong> participantsfailed to indicate that <strong>the</strong> alleged robustness of a technique againstviolations of <strong>the</strong> relevant assumption was a reason not to check<strong>the</strong>se assumptions in <strong>the</strong> first place. Many participants did notknow whe<strong>the</strong>r a violation of an assumption was important or not.Only in a minority of instances was an acceptable remedy for aviolation of an assumption mentioned. No unacceptable remedieswere mentioned. In general, participants indicated little knowledgeof how to overcome a violation of one of <strong>the</strong> assumptions,<strong>and</strong> most participants reported never having looked for a remedyagainst a violation of statistical assumptions.Participants had been told what <strong>the</strong> relevant assumptions werebefore <strong>the</strong>y had to answer <strong>the</strong>se questions. Therefore, <strong>the</strong> resultsfor <strong>the</strong> last three explanations per assumption in Figure 3 arereported for all participants,despite <strong>the</strong> fact that many participantsreported being unfamiliar with <strong>the</strong> assumption. This implies that,especially for <strong>the</strong> assumption of normality <strong>and</strong> to a lesser extentfor <strong>the</strong> assumption of equal variances, <strong>the</strong> results regarding <strong>the</strong> lastthree explanations should be interpreted with caution.DISCUSSIONIn order to examine people’s underst<strong>and</strong>ing of <strong>the</strong> assumptionsof statistical tests <strong>and</strong> <strong>the</strong>ir behavior with regard to checking<strong>the</strong>se assumptions, 30 researchers were asked to analyze six <strong>data</strong>sets using <strong>the</strong> t-test, ANOVA, regression or a non-parametricFIGURE 2 | The frequency of whe<strong>the</strong>r two assumptions were checked atall, whe<strong>the</strong>r <strong>the</strong>y were checked correctly, <strong>and</strong> whe<strong>the</strong>r a preliminary testwas used for three often used techniques in percentages of <strong>the</strong> totalnumber of cases. Between brackets are 95% CIs for <strong>the</strong> percentages.www.frontiersin.org May 2012 | Volume 3 | Article 137 | 12