

Sweating the Small Stuff: Does data cleaning and testing ... - Frontiers
Sweating the Small Stuff: Does data cleaning and testing ... - Frontiers
Sweating the Small Stuff: Does data cleaning and testing ... - Frontiers
- No tags were found...

Create successful ePaper yourself
Turn your PDF publications into a flip-book with our unique Google optimized e-Paper software.
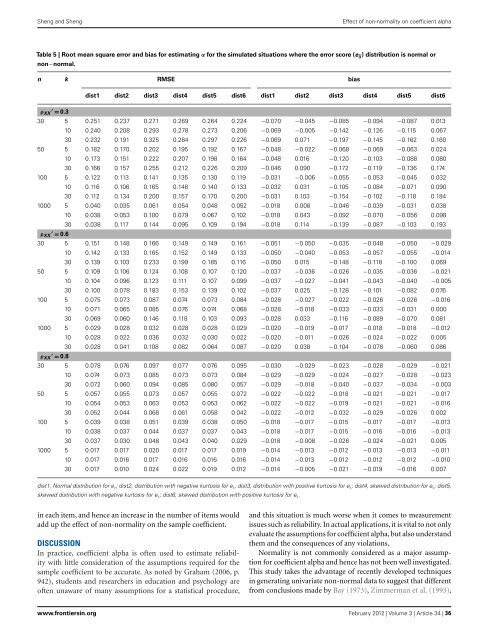
Sheng <strong>and</strong> ShengEffect of non-normality on coefficient alphaTable 5 | Root mean square error <strong>and</strong> bias for estimating α for <strong>the</strong> simulated situations where <strong>the</strong> error score (e ij ) distribution is normal ornon−normal.n k RMSE biasdist1 dist2 dist3 dist4 dist5 dist6 dist1 dist2 dist3 dist4 dist5 dist6ρ ′ XX = 0.330 5 0.251 0.237 0.271 0.269 0.264 0.224 −0.070 −0.045 −0.085 −0.094 −0.087 0.01310 0.240 0.208 0.293 0.278 0.273 0.206 −0.069 −0.005 −0.142 −0.126 −0.115 0.06730 0.232 0.191 0.325 0.284 0.297 0.226 −0.069 0.071 −0.197 −0.145 −0.162 0.16050 5 0.182 0.170 0.202 0.195 0.192 0.167 −0.048 −0.022 −0.068 −0.069 −0.063 0.02410 0.173 0.151 0.222 0.207 0.198 0.164 −0.048 0.016 −0.120 −0.103 −0.088 0.08030 0.166 0.157 0.255 0.212 0.226 0.209 −0.046 0.090 −0.172 −0.119 −0.136 0.174100 5 0.122 0.113 0.141 0.135 0.130 0.119 −0.031 −0.006 −0.055 −0.053 −0.045 0.03210 0.116 0.106 0.165 0.148 0.140 0.133 −0.032 0.031 −0.105 −0.084 −0.071 0.09030 0.112 0.134 0.200 0.157 0.170 0.200 −0.031 0.103 −0.154 −0.102 −0.118 0.1841000 5 0.040 0.035 0.061 0.054 0.048 0.052 −0.018 0.008 −0.046 −0.039 −0.031 0.03810 0.038 0.053 0.100 0.079 0.067 0.102 −0.018 0.043 −0.092 −0.070 −0.056 0.09830 0.038 0.117 0.144 0.095 0.109 0.194 −0.018 0.114 −0.139 −0.087 −0.103 0.193ρ ′ XX = 0.630 5 0.151 0.148 0.166 0.149 0.149 0.161 −0.051 −0.050 −0.035 −0.048 −0.050 −0.02910 0.142 0.133 0.165 0.152 0.149 0.133 −0.050 −0.040 −0.053 −0.057 −0.055 −0.01430 0.139 0.103 0.233 0.199 0.185 0.116 −0.050 0.015 −0.148 −0.118 −0.100 0.06950 5 0.109 0.106 0.124 0.108 0.107 0.120 −0.037 −0.036 −0.026 −0.035 −0.036 −0.02110 0.104 0.096 0.123 0.111 0.107 0.099 −0.037 −0.027 −0.041 −0.043 −0.040 −0.00530 0.100 0.078 0.183 0.153 0.139 0.102 −0.037 0.025 −0.128 −0.101 −0.082 0.076100 5 0.075 0.073 0.087 0.074 0.073 0.084 −0.028 −0.027 −0.022 −0.026 −0.026 −0.01610 0.071 0.065 0.085 0.076 0.074 0.068 −0.028 −0.018 −0.033 −0.033 −0.031 0.00030 0.069 0.060 0.146 0.118 0.103 0.093 −0.028 0.033 −0.116 −0.089 −0.070 0.0811000 5 0.029 0.028 0.032 0.028 0.028 0.029 −0.020 −0.019 −0.017 −0.018 −0.018 −0.01210 0.028 0.022 0.036 0.032 0.030 0.022 −0.020 −0.011 −0.026 −0.024 −0.022 0.00530 0.028 0.041 0.108 0.082 0.064 0.087 −0.020 0.038 −0.104 −0.078 −0.060 0.086ρ ′ XX = 0.830 5 0.078 0.076 0.097 0.077 0.076 0.095 −0.030 −0.029 −0.023 −0.028 −0.029 −0.02110 0.074 0.073 0.085 0.073 0.073 0.084 −0.029 −0.029 −0.024 −0.027 −0.028 −0.02330 0.072 0.060 0.094 0.085 0.080 0.057 −0.029 −0.018 −0.040 −0.037 −0.034 −0.00350 5 0.057 0.055 0.073 0.057 0.055 0.072 −0.022 −0.022 −0.018 −0.021 −0.021 −0.01710 0.054 0.053 0.063 0.053 0.053 0.062 −0.022 −0.022 −0.019 −0.021 −0.021 −0.01630 0.052 0.044 0.068 0.061 0.058 0.042 −0.022 −0.012 −0.032 −0.029 −0.026 0.002100 5 0.039 0.038 0.051 0.039 0.038 0.050 −0.018 −0.017 −0.015 −0.017 −0.017 −0.01310 0.038 0.037 0.044 0.037 0.037 0.043 −0.018 −0.017 −0.015 −0.016 −0.016 −0.01330 0.037 0.030 0.048 0.043 0.040 0.029 −0.018 −0.008 −0.026 −0.024 −0.021 0.0051000 5 0.017 0.017 0.020 0.017 0.017 0.019 −0.014 −0.013 −0.012 −0.013 −0.013 −0.01110 0.017 0.016 0.017 0.016 0.016 0.016 −0.014 −0.013 −0.012 −0.012 −0.012 −0.01030 0.017 0.010 0.024 0.022 0.019 0.012 −0.014 −0.005 −0.021 −0.019 −0.016 0.007dist1, Normal distribution for e ij ; dist2, distribution with negative kurtosis for e ij ; dist3, distribution with positive kurtosis for e ij ; dist4, skewed distribution for e ij ; dist5,skewed distribution with negative kurtosis for e ij ; dist6, skewed distribution with positive kurtosis for e ij .in each item, <strong>and</strong> hence an increase in <strong>the</strong> number of items wouldadd up <strong>the</strong> effect of non-normality on <strong>the</strong> sample coefficient.DISCUSSIONIn practice, coefficient alpha is often used to estimate reliabilitywith little consideration of <strong>the</strong> assumptions required for <strong>the</strong>sample coefficient to be accurate. As noted by Graham (2006, p.942), students <strong>and</strong> researchers in education <strong>and</strong> psychology areoften unaware of many assumptions for a statistical procedure,<strong>and</strong> this situation is much worse when it comes to measurementissues such as reliability. In actual applications, it is vital to not onlyevaluate <strong>the</strong> assumptions for coefficient alpha, but also underst<strong>and</strong><strong>the</strong>m <strong>and</strong> <strong>the</strong> consequences of any violations.Normality is not commonly considered as a major assumptionfor coefficient alpha <strong>and</strong> hence has not been well investigated.This study takes <strong>the</strong> advantage of recently developed techniquesin generating univariate non-normal <strong>data</strong> to suggest that differentfrom conclusions made by Bay (1973), Zimmerman et al. (1993),www.frontiersin.org February 2012 | Volume 3 | Article 34 | 36


