

Sweating the Small Stuff: Does data cleaning and testing ... - Frontiers
Sweating the Small Stuff: Does data cleaning and testing ... - Frontiers
Sweating the Small Stuff: Does data cleaning and testing ... - Frontiers
- No tags were found...

Create successful ePaper yourself
Turn your PDF publications into a flip-book with our unique Google optimized e-Paper software.
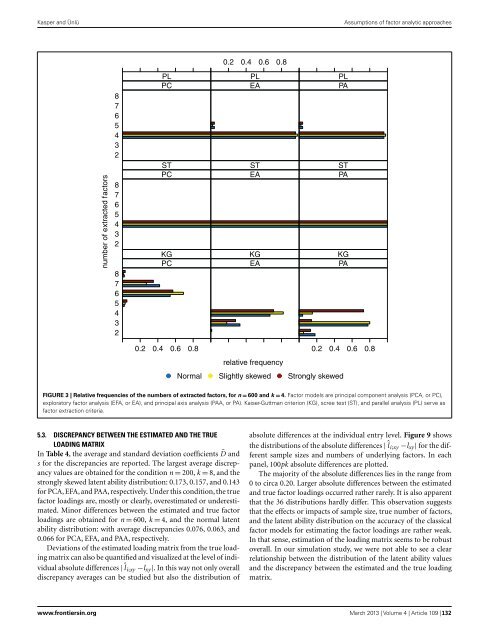
Kasper <strong>and</strong> ÜnlüAssumptions of factor analytic approaches0.2 0.4 0.6 0.8number of extracted factors876543287654328765432PLPCSTPCKGPCPLEASTEAKGEAPLPASTPAKGPA0.2 0.4 0.6 0.80.2 0.4 0.6 0.8relative frequencyNormal Slightly skewed Strongly skewedFIGURE 3 | Relative frequencies of <strong>the</strong> numbers of extracted factors, for n = 600 <strong>and</strong> k = 4. Factor models are principal component analysis (PCA, or PC),exploratory factor analysis (EFA, or EA), <strong>and</strong> principal axis analysis (PAA, or PA). Kaiser-Guttman criterion (KG), scree test (ST), <strong>and</strong> parallel analysis (PL) serve asfactor extraction criteria.5.3. DISCREPANCY BETWEEN THE ESTIMATED AND THE TRUELOADING MATRIXIn Table 4, <strong>the</strong> average <strong>and</strong> st<strong>and</strong>ard deviation coefficients ¯D <strong>and</strong>s for <strong>the</strong> discrepancies are reported. The largest average discrepancyvalues are obtained for <strong>the</strong> condition n = 200, k = 8, <strong>and</strong> <strong>the</strong>strongly skewed latent ability distribution: 0.173, 0.157, <strong>and</strong> 0.143for PCA, EFA, <strong>and</strong> PAA, respectively. Under this condition, <strong>the</strong> truefactor loadings are, mostly or clearly, overestimated or underestimated.Minor differences between <strong>the</strong> estimated <strong>and</strong> true factorloadings are obtained for n = 600, k = 4, <strong>and</strong> <strong>the</strong> normal latentability distribution: with average discrepancies 0.076, 0.063, <strong>and</strong>0.066 for PCA, EFA, <strong>and</strong> PAA, respectively.Deviations of <strong>the</strong> estimated loading matrix from <strong>the</strong> true loadingmatrix can also be quantified <strong>and</strong> visualized at <strong>the</strong> level of individualabsolute differences | ˆl i;xy −l xy |. In this way not only overalldiscrepancy averages can be studied but also <strong>the</strong> distribution ofabsolute differences at <strong>the</strong> individual entry level. Figure 9 shows<strong>the</strong> distributions of <strong>the</strong> absolute differences | ˆl i;xy −l xy | for <strong>the</strong> differentsample sizes <strong>and</strong> numbers of underlying factors. In eachpanel, 100pk absolute differences are plotted.The majority of <strong>the</strong> absolute differences lies in <strong>the</strong> range from0 to circa 0.20. Larger absolute differences between <strong>the</strong> estimated<strong>and</strong> true factor loadings occurred ra<strong>the</strong>r rarely. It is also apparentthat <strong>the</strong> 36 distributions hardly differ. This observation suggeststhat <strong>the</strong> effects or impacts of sample size, true number of factors,<strong>and</strong> <strong>the</strong> latent ability distribution on <strong>the</strong> accuracy of <strong>the</strong> classicalfactor models for estimating <strong>the</strong> factor loadings are ra<strong>the</strong>r weak.In that sense, estimation of <strong>the</strong> loading matrix seems to be robustoverall. In our simulation study, we were not able to see a clearrelationship between <strong>the</strong> distribution of <strong>the</strong> latent ability values<strong>and</strong> <strong>the</strong> discrepancy between <strong>the</strong> estimated <strong>and</strong> <strong>the</strong> true loadingmatrix.www.frontiersin.org March 2013 | Volume 4 | Article 109 | 132


