

Sweating the Small Stuff: Does data cleaning and testing ... - Frontiers
Sweating the Small Stuff: Does data cleaning and testing ... - Frontiers
Sweating the Small Stuff: Does data cleaning and testing ... - Frontiers
- No tags were found...

Create successful ePaper yourself
Turn your PDF publications into a flip-book with our unique Google optimized e-Paper software.
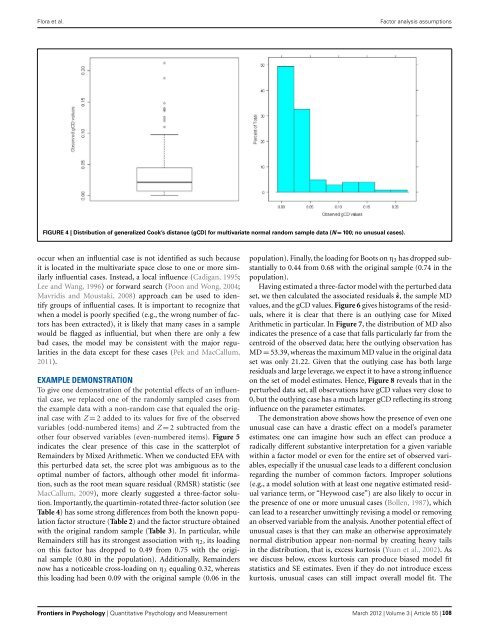
Flora et al.Factor analysis assumptionsFIGURE 4 | Distribution of generalized Cook’s distance (gCD) for multivariate normal r<strong>and</strong>om sample <strong>data</strong> (N = 100; no unusual cases).occur when an influential case is not identified as such becauseit is located in <strong>the</strong> multivariate space close to one or more similarlyinfluential cases. Instead, a local influence (Cadigan, 1995;Lee <strong>and</strong> Wang, 1996) or forward search (Poon <strong>and</strong> Wong, 2004;Mavridis <strong>and</strong> Moustaki, 2008) approach can be used to identifygroups of influential cases. It is important to recognize thatwhen a model is poorly specified (e.g., <strong>the</strong> wrong number of factorshas been extracted), it is likely that many cases in a samplewould be flagged as influential, but when <strong>the</strong>re are only a fewbad cases, <strong>the</strong> model may be consistent with <strong>the</strong> major regularitiesin <strong>the</strong> <strong>data</strong> except for <strong>the</strong>se cases (Pek <strong>and</strong> MacCallum,2011).EXAMPLE DEMONSTRATIONTo give one demonstration of <strong>the</strong> potential effects of an influentialcase, we replaced one of <strong>the</strong> r<strong>and</strong>omly sampled cases from<strong>the</strong> example <strong>data</strong> with a non-r<strong>and</strong>om case that equaled <strong>the</strong> originalcase with Z = 2 added to its values for five of <strong>the</strong> observedvariables (odd-numbered items) <strong>and</strong> Z = 2subtractedfrom<strong>the</strong>o<strong>the</strong>r four observed variables (even-numbered items). Figure 5indicates <strong>the</strong> clear presence of this case in <strong>the</strong> scatterplot ofRemainders by Mixed Arithmetic. When we conducted EFA withthis perturbed <strong>data</strong> set, <strong>the</strong> scree plot was ambiguous as to <strong>the</strong>optimal number of factors, although o<strong>the</strong>r model fit information,such as <strong>the</strong> root mean square residual (RMSR) statistic (seeMacCallum, 2009), more clearly suggested a three-factor solution.Importantly, <strong>the</strong> quartimin-rotated three-factor solution (seeTable 4) has some strong differences from both <strong>the</strong> known populationfactor structure (Table 2) <strong>and</strong> <strong>the</strong> factor structure obtainedwith <strong>the</strong> original r<strong>and</strong>om sample (Table 3). In particular, whileRemainders still has its strongest association with η 2 , its loadingon this factor has dropped to 0.49 from 0.75 with <strong>the</strong> originalsample (0.80 in <strong>the</strong> population). Additionally, Remaindersnow has a noticeable cross-loading on η 3 equaling 0.32, whereasthis loading had been 0.09 with <strong>the</strong> original sample (0.06 in <strong>the</strong>population). Finally, <strong>the</strong> loading for Boots on η 3 has dropped substantiallyto 0.44 from 0.68 with <strong>the</strong> original sample (0.74 in <strong>the</strong>population).Having estimated a three-factor model with <strong>the</strong> perturbed <strong>data</strong>set, we <strong>the</strong>n calculated <strong>the</strong> associated residuals ˆε, <strong>the</strong> sample MDvalues, <strong>and</strong> <strong>the</strong> gCD values. Figure 6 gives histograms of <strong>the</strong> residuals,where it is clear that <strong>the</strong>re is an outlying case for MixedArithmetic in particular. In Figure 7, <strong>the</strong> distribution of MD alsoindicates <strong>the</strong> presence of a case that falls particularly far from <strong>the</strong>centroid of <strong>the</strong> observed <strong>data</strong>; here <strong>the</strong> outlying observation hasMD = 53.39, whereas <strong>the</strong> maximum MD value in <strong>the</strong> original <strong>data</strong>set was only 21.22. Given that <strong>the</strong> outlying case has both largeresiduals <strong>and</strong> large leverage, we expect it to have a strong influenceon <strong>the</strong> set of model estimates. Hence, Figure 8 reveals that in <strong>the</strong>perturbed <strong>data</strong> set, all observations have gCD values very close to0, but <strong>the</strong> outlying case has a much larger gCD reflecting its stronginfluence on <strong>the</strong> parameter estimates.The demonstration above shows how <strong>the</strong> presence of even oneunusual case can have a drastic effect on a model’s parameterestimates; one can imagine how such an effect can produce aradically different substantive interpretation for a given variablewithin a factor model or even for <strong>the</strong> entire set of observed variables,especially if <strong>the</strong> unusual case leads to a different conclusionregarding <strong>the</strong> number of common factors. Improper solutions(e.g., a model solution with at least one negative estimated residualvariance term, or “Heywood case”) are also likely to occur in<strong>the</strong> presence of one or more unusual cases (Bollen, 1987), whichcan lead to a researcher unwittingly revising a model or removingan observed variable from <strong>the</strong> analysis. Ano<strong>the</strong>r potential effect ofunusual cases is that <strong>the</strong>y can make an o<strong>the</strong>rwise approximatelynormal distribution appear non-normal by creating heavy tailsin <strong>the</strong> distribution, that is, excess kurtosis (Yuan et al., 2002). Aswe discuss below, excess kurtosis can produce biased model fitstatistics <strong>and</strong> SE estimates. Even if <strong>the</strong>y do not introduce excesskurtosis, unusual cases can still impact overall model fit. The<strong>Frontiers</strong> in Psychology | Quantitative Psychology <strong>and</strong> Measurement March 2012 | Volume 3 | Article 55 | 108


