01. Newcasle West Local Area Plan ( pdf file - 3593 kb in size)
01. Newcasle West Local Area Plan ( pdf file - 3593 kb in size)
01. Newcasle West Local Area Plan ( pdf file - 3593 kb in size)
- No tags were found...

You also want an ePaper? Increase the reach of your titles
YUMPU automatically turns print PDFs into web optimized ePapers that Google loves.
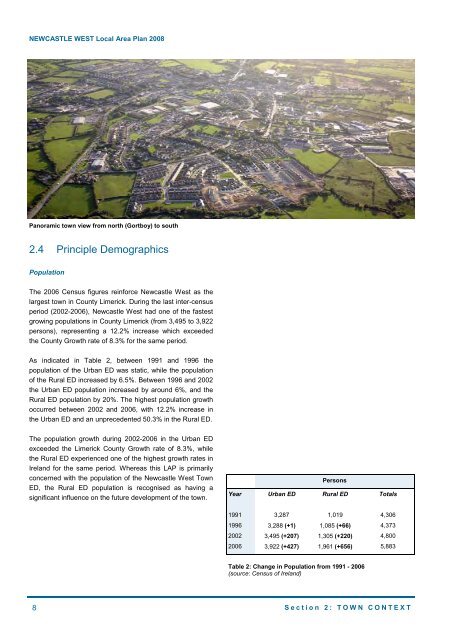
NEWCASTLE WEST <strong>Local</strong> <strong>Area</strong> <strong>Plan</strong> 2008Panoramic town view from north (Gortboy) to south2.4 Pr<strong>in</strong>ciple DemographicsPopulationThe 2006 Census figures re<strong>in</strong>force Newcastle <strong>West</strong> as thelargest town <strong>in</strong> County Limerick. Dur<strong>in</strong>g the last <strong>in</strong>ter-censusperiod (2002-2006), Newcastle <strong>West</strong> had one of the fastestgrow<strong>in</strong>g populations <strong>in</strong> County Limerick (from 3,495 to 3,922persons), represent<strong>in</strong>g a 12.2% <strong>in</strong>crease which exceededthe County Growth rate of 8.3% for the same period.As <strong>in</strong>dicated <strong>in</strong> Table 2, between 1991 and 1996 thepopulation of the Urban ED was static, while the populationof the Rural ED <strong>in</strong>creased by 6.5%. Between 1996 and 2002the Urban ED population <strong>in</strong>creased by around 6%, and theRural ED population by 20%. The highest population growthoccurred between 2002 and 2006, with 12.2% <strong>in</strong>crease <strong>in</strong>the Urban ED and an unprecedented 50.3% <strong>in</strong> the Rural ED.The population growth dur<strong>in</strong>g 2002-2006 <strong>in</strong> the Urban EDexceeded the Limerick County Growth rate of 8.3%, whilethe Rural ED experienced one of the highest growth rates <strong>in</strong>Ireland for the same period. Whereas this LAP is primarilyconcerned with the population of the Newcastle <strong>West</strong> TownED, the Rural ED population is recognised as hav<strong>in</strong>g asignificant <strong>in</strong>fluence on the future development of the town.YearUrban EDPersonsRural EDTotals19913,2871,0194,30619963,288 (+1)1,085 (+66)4,37320023,495 (+207)1,305 (+220)4,80020063,922 (+427)1,961 (+656)5,883Table 2: Change <strong>in</strong> Population from 1991 - 2006(source: Census of Ireland)8 Section 2: TOWN CONTEXT