01. Newcasle West Local Area Plan ( pdf file - 3593 kb in size)
01. Newcasle West Local Area Plan ( pdf file - 3593 kb in size)
01. Newcasle West Local Area Plan ( pdf file - 3593 kb in size)
- No tags were found...

You also want an ePaper? Increase the reach of your titles
YUMPU automatically turns print PDFs into web optimized ePapers that Google loves.
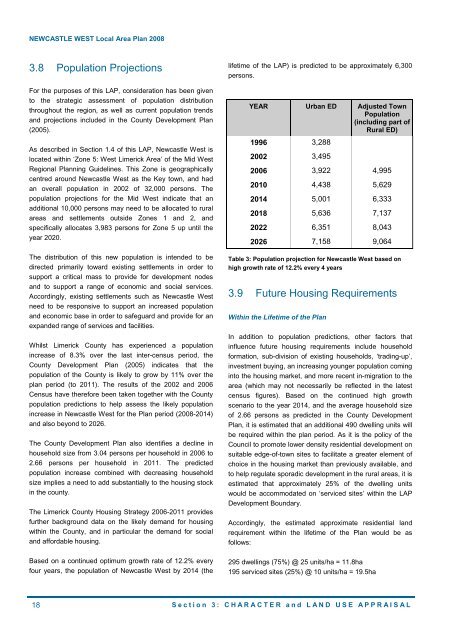
NEWCASTLE WEST <strong>Local</strong> <strong>Area</strong> <strong>Plan</strong> 20083.8 Population ProjectionsFor the purposes of this LAP, consideration has been givento the strategic assessment of population distributionthroughout the region, as well as current population trendsand projections <strong>in</strong>cluded <strong>in</strong> the County Development <strong>Plan</strong>(2005).As described <strong>in</strong> Section 1.4 of this LAP, Newcastle <strong>West</strong> islocated with<strong>in</strong> ‘Zone 5: <strong>West</strong> Limerick <strong>Area</strong>’ of the Mid <strong>West</strong>Regional <strong>Plan</strong>n<strong>in</strong>g Guidel<strong>in</strong>es. This Zone is geographicallycentred around Newcastle <strong>West</strong> as the Key town, and hadan overall population <strong>in</strong> 2002 of 32,000 persons. Thepopulation projections for the Mid <strong>West</strong> <strong>in</strong>dicate that anadditional 10,000 persons may need to be allocated to ruralareas and settlements outside Zones 1 and 2, andspecifically allocates 3,983 persons for Zone 5 up until theyear 2020.The distribution of this new population is <strong>in</strong>tended to bedirected primarily toward exist<strong>in</strong>g settlements <strong>in</strong> order tosupport a critical mass to provide for development nodesand to support a range of economic and social services.Accord<strong>in</strong>gly, exist<strong>in</strong>g settlements such as Newcastle <strong>West</strong>need to be responsive to support an <strong>in</strong>creased populationand economic base <strong>in</strong> order to safeguard and provide for anexpanded range of services and facilities.Whilst Limerick County has experienced a population<strong>in</strong>crease of 8.3% over the last <strong>in</strong>ter-census period, theCounty Development <strong>Plan</strong> (2005) <strong>in</strong>dicates that thepopulation of the County is likely to grow by 11% over theplan period (to 2011). The results of the 2002 and 2006Census have therefore been taken together with the Countypopulation predictions to help assess the likely population<strong>in</strong>crease <strong>in</strong> Newcastle <strong>West</strong> for the <strong>Plan</strong> period (2008-2014)and also beyond to 2026.The County Development <strong>Plan</strong> also identifies a decl<strong>in</strong>e <strong>in</strong>household <strong>size</strong> from 3.04 persons per household <strong>in</strong> 2006 to2.66 persons per household <strong>in</strong> 2011. The predictedpopulation <strong>in</strong>crease comb<strong>in</strong>ed with decreas<strong>in</strong>g household<strong>size</strong> implies a need to add substantially to the hous<strong>in</strong>g stock<strong>in</strong> the county.The Limerick County Hous<strong>in</strong>g Strategy 2006-2011 providesfurther background data on the likely demand for hous<strong>in</strong>gwith<strong>in</strong> the County, and <strong>in</strong> particular the demand for socialand affordable hous<strong>in</strong>g.Based on a cont<strong>in</strong>ued optimum growth rate of 12.2% everyfour years, the population of Newcastle <strong>West</strong> by 2014 (thelifetime of the LAP) is predicted to be approximately 6,300persons.YEAR Urban ED Adjusted TownPopulation(<strong>in</strong>clud<strong>in</strong>g part ofRural ED)1996 3,2882002 3,4952006 3,922 4,9952010 4,438 5,6292014 5,001 6,3332018 5,636 7,1372022 6,351 8,0432026 7,158 9,064Table 3: Population projection for Newcastle <strong>West</strong> based onhigh growth rate of 12.2% every 4 years3.9 Future Hous<strong>in</strong>g RequirementsWith<strong>in</strong> the Lifetime of the <strong>Plan</strong>In addition to population predictions, other factors that<strong>in</strong>fluence future hous<strong>in</strong>g requirements <strong>in</strong>clude householdformation, sub-division of exist<strong>in</strong>g households, ‘trad<strong>in</strong>g-up’,<strong>in</strong>vestment buy<strong>in</strong>g, an <strong>in</strong>creas<strong>in</strong>g younger population com<strong>in</strong>g<strong>in</strong>to the hous<strong>in</strong>g market, and more recent <strong>in</strong>-migration to thearea (which may not necessarily be reflected <strong>in</strong> the latestcensus figures). Based on the cont<strong>in</strong>ued high growthscenario to the year 2014, and the average household <strong>size</strong>of 2.66 persons as predicted <strong>in</strong> the County Development<strong>Plan</strong>, it is estimated that an additional 490 dwell<strong>in</strong>g units willbe required with<strong>in</strong> the plan period. As it is the policy of theCouncil to promote lower density residential development onsuitable edge-of-town sites to facilitate a greater element ofchoice <strong>in</strong> the hous<strong>in</strong>g market than previously available, andto help regulate sporadic development <strong>in</strong> the rural areas, it isestimated that approximately 25% of the dwell<strong>in</strong>g unitswould be accommodated on ‘serviced sites’ with<strong>in</strong> the LAPDevelopment Boundary.Accord<strong>in</strong>gly, the estimated approximate residential landrequirement with<strong>in</strong> the lifetime of the <strong>Plan</strong> would be asfollows:295 dwell<strong>in</strong>gs (75%) @ 25 units/ha = 11.8ha195 serviced sites (25%) @ 10 units/ha = 19.5ha18 Section 3: CHARACTER and LAND USE APPRAISAL