I. Family Dilemma: Child Care Af<strong>for</strong>dabilityWHAT TYPES OF CHILD CARE CAN FAMILIES AFFORD?Assum<strong>in</strong>g “af<strong>for</strong>dable” means pay<strong>in</strong>g no more than 10 percent of the family <strong>in</strong>come on <strong>child</strong> <strong>care</strong>, here are thetypes of <strong>care</strong> our families can af<strong>for</strong>d based on the average cost of <strong>care</strong>.GABRIELLE AND SHAWN HARRIS:WORKING PARENTS WITH INFANTAND TODDLER. INCOME IS$89,400 PER YEAR.S<strong>in</strong>ce this couple is not eligible <strong>for</strong>CCAP, their options are limited. Budget -<strong>in</strong>g 10 percent of their <strong>in</strong>come, theycould pay as much as $172 per weektoward <strong>child</strong> <strong>care</strong> or $745 per month.With that budget, few types of <strong>care</strong> areavailable to them. The lowest averagecomb<strong>in</strong>ed price of regulated <strong>in</strong>fant andtoddler <strong>care</strong>, $265 weekly, occurs <strong>in</strong>licensed family <strong>child</strong> <strong>care</strong> homes <strong>in</strong>South and Southwest Chicago. At about15 percent of their <strong>in</strong>come, even this<strong>care</strong> would be unaf<strong>for</strong>dable by the10 percent standard.Af<strong>for</strong>dable options <strong>for</strong> this couple<strong>in</strong>clude cont<strong>in</strong>u<strong>in</strong>g to stagger their workschedules so that they can <strong>care</strong> <strong>for</strong> their<strong>child</strong>ren themselves (with the help ofShawn’s sister) and look<strong>in</strong>g <strong>for</strong><strong>in</strong>expensive family, friend or neighbor<strong>child</strong> <strong>care</strong>.CANDACE THOMAS: WORKINGMOTHER WITH THREE CHILDREN.INCOME IS $44,800 PER YEAR.Candace earns just $200 a monthabove the annual cut off <strong>for</strong> CCAP.She can spend about $86 per week tostay with<strong>in</strong> 10 percent of her <strong>in</strong>come.But if she wants to use center <strong>care</strong>,that amount would not pay <strong>for</strong> any oneof her <strong>child</strong>ren, not even less expensivebe<strong>for</strong>e-and-after-school <strong>care</strong> <strong>for</strong> hereight-year old, much less all three<strong>child</strong>ren.Like the family above, family, friend,or neighbor <strong>care</strong> is the only type of <strong>care</strong>that might cost Candace less than 10percent of her <strong>in</strong>come. Without CCAP,the licensed family <strong>child</strong> <strong>care</strong> that shecurrently uses costs her 28 percent ofher <strong>in</strong>come, not a susta<strong>in</strong> able option.(A more typical rate <strong>for</strong> licensed home<strong>care</strong> would take 40 percent of her<strong>in</strong>come.) If a raise does not comethrough, she might try to reduce her<strong>in</strong>come back below the eligibility cutoffso that she can receive CCAP support.ALBERTA REYES: WORKINGMOTHER WITH A PRESCHOOLER.INCOME IS $16,138 PER YEAR.To stay with<strong>in</strong> 10 percent of her <strong>in</strong>come,<strong>in</strong>clud<strong>in</strong>g <strong>child</strong> support, Alberta would beable to pay as much as $31 per weekon <strong>child</strong> <strong>care</strong>. If she receives CCAPsupport, <strong>for</strong> which she is eligible, shewill have to pay $25 per week <strong>for</strong> herco-payment. If Alberta is able to f<strong>in</strong>d a<strong>child</strong> <strong>care</strong> provider who accepts CCAPpayments and who expects noth<strong>in</strong>gbeyond her co-payment, Alberta willhave access to both center and licensedhome <strong>child</strong> <strong>care</strong>.However, s<strong>in</strong>ce the rates paid by theCCAP tend to be less than the averagerates charged by centers and licensedhome providers, these providers mightask Alberta to pay the difference. In thiscase, Alberta would be priced out ofaverage-priced center <strong>care</strong> except <strong>in</strong> theSouth and Southwest Chicago region.Licensed home <strong>care</strong> <strong>in</strong> the Central andWest Chicago region and the South andSouthwest Chicago and suburbanregions would be af<strong>for</strong>dable <strong>for</strong> her. Inall other regions, she would only be ableto af<strong>for</strong>d family, friend or neighbor <strong>care</strong>.Another state program that provides<strong>child</strong> <strong>care</strong> assistance, but to a morespecific population, is the Depart mentof <strong>Children</strong> and Family Services (DCFS).DCFS provides <strong>child</strong> <strong>care</strong> vouchersprimarily to families with foster <strong>child</strong>ren.Beyond government-funded programs,a number of <strong>child</strong> <strong>care</strong> providers offertheir own <strong>for</strong>ms of <strong>child</strong> <strong>care</strong> assistance.These <strong>in</strong>clude discounts <strong>for</strong>parents with more than one <strong>child</strong> <strong>in</strong>their <strong>care</strong>, slid<strong>in</strong>g scale fees based ona family’s ability to pay, scholarships,and negotiable rates. Some providerswill accept the CCAP reimbursementas full payment even though theamount they receive through the programmay be less than what theproviders typically charge.Both the federal and Ill<strong>in</strong>ois <strong>in</strong>cometax programs offer some relief<strong>for</strong> <strong>child</strong> <strong>care</strong> costs <strong>in</strong> the <strong>for</strong>m ofmodest dependent <strong>child</strong> <strong>care</strong> taxcredits. These credits allow familiesto reduce their <strong>in</strong>come tax bill by afraction of their <strong>child</strong> <strong>care</strong> expenses.9
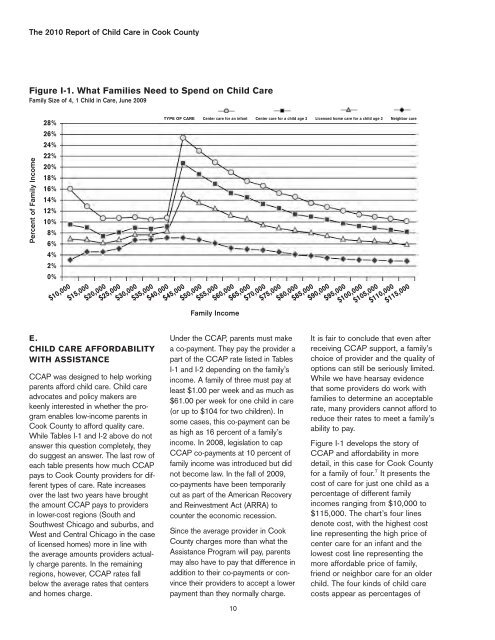
The 2010 Report of Child Care <strong>in</strong> Cook CountyFigure I-1. What Families Need to Spend on Child CareFamily Size of 4, 1 Child <strong>in</strong> Care, June 2009Percent of Family Income28%26%24%22%20%18%16%14%12%10%8%6%4%2%0%$10,000$15,000E.CHILD CARE AFFORDABILITYWITH ASSISTANCECCAP was designed to help work<strong>in</strong>gparents af<strong>for</strong>d <strong>child</strong> <strong>care</strong>. Child <strong>care</strong>advocates and policy makers arekeenly <strong>in</strong>terested <strong>in</strong> whether the programenables low-<strong>in</strong>come parents <strong>in</strong>Cook County to af<strong>for</strong>d quality <strong>care</strong>.While Tables I-1 and I-2 above do notanswer this question completely, theydo suggest an answer. The last row ofeach table presents how much CCAPpays to Cook County providers <strong>for</strong> differenttypes of <strong>care</strong>. Rate <strong>in</strong>creasesover the last two years have broughtthe amount CCAP pays to providers<strong>in</strong> lower-cost regions (South andSouth west Chicago and suburbs, andWest and Central Chicago <strong>in</strong> the caseof licensed homes) more <strong>in</strong> l<strong>in</strong>e withthe average amounts providers actuallycharge parents. In the rema<strong>in</strong><strong>in</strong>gregions, however, CCAP rates fallbelow the average rates that centersand homes charge.$20,000$25,000$30,000$35,000$40,000$45,000$50,000TYPE OF CARE Center <strong>care</strong> <strong>for</strong> an <strong>in</strong>fant Center <strong>care</strong> <strong>for</strong> a <strong>child</strong> age 2 Licensed home <strong>care</strong> <strong>for</strong> a <strong>child</strong> age 2 Neighbor <strong>care</strong>$55,000Family IncomeUnder the CCAP, parents must makea co-payment. They pay the provider apart of the CCAP rate listed <strong>in</strong> TablesI-1 and I-2 depend<strong>in</strong>g on the family’s<strong>in</strong>come. A family of three must pay atleast $1.00 per week and as much as$61.00 per week <strong>for</strong> one <strong>child</strong> <strong>in</strong> <strong>care</strong>(or up to $104 <strong>for</strong> two <strong>child</strong>ren). Insome cases, this co-payment can beas high as 16 percent of a family’s<strong>in</strong>come. In 2008, legislation to capCCAP co-payments at 10 percent offamily <strong>in</strong>come was <strong>in</strong>troduced but didnot become law. In the fall of 2009,co-payments have been temporarilycut as part of the American Recoveryand Re<strong>in</strong>vestment Act (ARRA) tocounter the economic recession.S<strong>in</strong>ce the average provider <strong>in</strong> CookCounty charges more than what theAssistance Program will pay, parentsmay also have to pay that difference <strong>in</strong>addition to their co-payments or conv<strong>in</strong>cetheir providers to accept a lowerpayment than they normally charge.$60,000$65,000$70,000$75,000$80,000$85,000$90,000$95,000$100,000$105,000$110,000$115,000It is fair to conclude that even afterreceiv<strong>in</strong>g CCAP support, a family’schoice of provider and the quality ofoptions can still be seriously limited.While we have hearsay evidencethat some providers do work withfamilies to determ<strong>in</strong>e an acceptablerate, many providers cannot af<strong>for</strong>d toreduce their rates to meet a family’sability to pay.Figure I-1 develops the story ofCCAP and af<strong>for</strong>dability <strong>in</strong> moredetail, <strong>in</strong> this case <strong>for</strong> Cook County<strong>for</strong> a family of four. 7 It presents thecost of <strong>care</strong> <strong>for</strong> just one <strong>child</strong> as apercentage of different family<strong>in</strong>comes rang<strong>in</strong>g from $10,000 to$115,000. The chart’s four l<strong>in</strong>esdenote cost, with the highest costl<strong>in</strong>e represent<strong>in</strong>g the high price ofcenter <strong>care</strong> <strong>for</strong> an <strong>in</strong>fant and thelowest cost l<strong>in</strong>e represent<strong>in</strong>g themore af<strong>for</strong>dable price of family,friend or neighbor <strong>care</strong> <strong>for</strong> an older<strong>child</strong>. The four k<strong>in</strong>ds of <strong>child</strong> <strong>care</strong>costs appear as percentages of10