child care in cook county - Illinois Action for Children
child care in cook county - Illinois Action for Children
child care in cook county - Illinois Action for Children

Create successful ePaper yourself
Turn your PDF publications into a flip-book with our unique Google optimized e-Paper software.
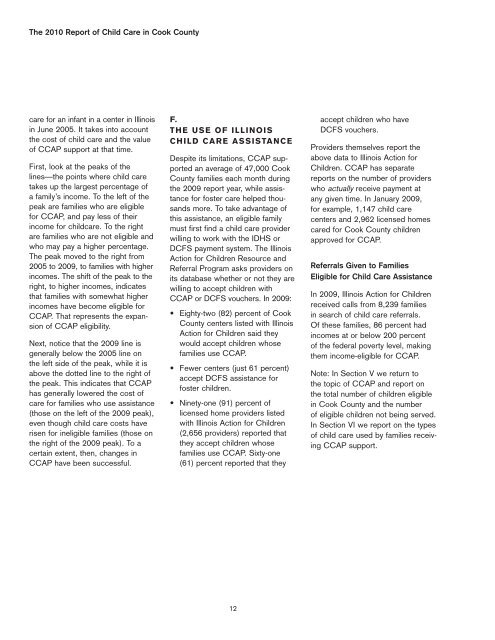
The 2010 Report of Child Care <strong>in</strong> Cook County<strong>care</strong> <strong>for</strong> an <strong>in</strong>fant <strong>in</strong> a center <strong>in</strong> Ill<strong>in</strong>ois<strong>in</strong> June 2005. It takes <strong>in</strong>to accountthe cost of <strong>child</strong> <strong>care</strong> and the valueof CCAP support at that time.First, look at the peaks of thel<strong>in</strong>es—the po<strong>in</strong>ts where <strong>child</strong> <strong>care</strong>takes up the largest percentage ofa family’s <strong>in</strong>come. To the left of thepeak are families who are eligible<strong>for</strong> CCAP, and pay less of their<strong>in</strong>come <strong>for</strong> <strong>child</strong><strong>care</strong>. To the rightare families who are not eligible andwho may pay a higher percentage.The peak moved to the right from2005 to 2009, to families with higher<strong>in</strong>comes. The shift of the peak to theright, to higher <strong>in</strong>comes, <strong>in</strong>dicatesthat families with somewhat higher<strong>in</strong>comes have become eligible <strong>for</strong>CCAP. That represents the expansionof CCAP eligibility.Next, notice that the 2009 l<strong>in</strong>e isgenerally below the 2005 l<strong>in</strong>e onthe left side of the peak, while it isabove the dotted l<strong>in</strong>e to the right ofthe peak. This <strong>in</strong>dicates that CCAPhas generally lowered the cost of<strong>care</strong> <strong>for</strong> families who use assistance(those on the left of the 2009 peak),even though <strong>child</strong> <strong>care</strong> costs haverisen <strong>for</strong> <strong>in</strong>eligible families (those onthe right of the 2009 peak). To acerta<strong>in</strong> extent, then, changes <strong>in</strong>CCAP have been successful.F.THE USE OF ILLINOISCHILD CARE ASSISTANCEDespite its limitations, CCAP supportedan average of 47,000 CookCounty families each month dur<strong>in</strong>gthe 2009 report year, while assistance<strong>for</strong> foster <strong>care</strong> helped thousandsmore. To take advantage ofthis assistance, an eligible familymust first f<strong>in</strong>d a <strong>child</strong> <strong>care</strong> providerwill<strong>in</strong>g to work with the IDHS orDCFS payment system. The Ill<strong>in</strong>ois<strong>Action</strong> <strong>for</strong> <strong>Children</strong> Resource andReferral Program asks providers onits database whether or not they arewill<strong>in</strong>g to accept <strong>child</strong>ren withCCAP or DCFS vouchers. In 2009:• Eighty-two (82) percent of CookCounty centers listed with Ill<strong>in</strong>ois<strong>Action</strong> <strong>for</strong> <strong>Children</strong> said theywould accept <strong>child</strong>ren whosefamilies use CCAP.• Fewer centers (just 61 percent)accept DCFS assistance <strong>for</strong>foster <strong>child</strong>ren.• N<strong>in</strong>ety-one (91) percent oflicensed home providers listedwith Ill<strong>in</strong>ois <strong>Action</strong> <strong>for</strong> <strong>Children</strong>(2,656 providers) reported thatthey accept <strong>child</strong>ren whosefamilies use CCAP. Sixty-one(61) percent reported that theyaccept <strong>child</strong>ren who haveDCFS vouchers.Providers themselves report theabove data to Ill<strong>in</strong>ois <strong>Action</strong> <strong>for</strong><strong>Children</strong>. CCAP has separatereports on the number of providerswho actually receive payment atany given time. In January 2009,<strong>for</strong> example, 1,147 <strong>child</strong> <strong>care</strong>centers and 2,962 licensed homes<strong>care</strong>d <strong>for</strong> Cook County <strong>child</strong>renapproved <strong>for</strong> CCAP.Referrals Given to FamiliesEligible <strong>for</strong> Child Care AssistanceIn 2009, Ill<strong>in</strong>ois <strong>Action</strong> <strong>for</strong> <strong>Children</strong>received calls from 8,239 families<strong>in</strong> search of <strong>child</strong> <strong>care</strong> referrals.Of these families, 86 percent had<strong>in</strong>comes at or below 200 percentof the federal poverty level, mak<strong>in</strong>gthem <strong>in</strong>come-eligible <strong>for</strong> CCAP.Note: In Section V we return tothe topic of CCAP and report onthe total number of <strong>child</strong>ren eligible<strong>in</strong> Cook County and the numberof eligible <strong>child</strong>ren not be<strong>in</strong>g served.In Section VI we report on the typesof <strong>child</strong> <strong>care</strong> used by families receiv<strong>in</strong>gCCAP support.12