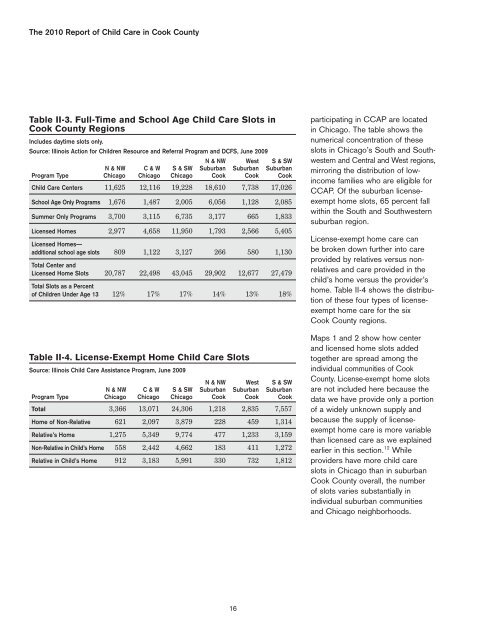
In 2009, there were 1,456 full-time<strong>child</strong> <strong>care</strong> centers offer<strong>in</strong>g 100,780<strong>child</strong> <strong>care</strong> slots dur<strong>in</strong>g the full yearor school year, as well as 19,225full-time slots dur<strong>in</strong>g the summermonths. Child <strong>care</strong> centers offeredmore than half of the total knownfull and school-year capacity <strong>in</strong>Cook County.As of June 2009, DCFS had listed3,946 licensed family and group<strong>child</strong> <strong>care</strong> homes <strong>in</strong> Cook Countywith slots <strong>for</strong> 36,383 <strong>child</strong>ren. Eachprovider was licensed to <strong>care</strong> <strong>for</strong>an average of 7.4 <strong>child</strong>ren dur<strong>in</strong>gthe day, not <strong>in</strong>clud<strong>in</strong>g up to fouradditional school age <strong>child</strong>ren theymay be licensed to <strong>care</strong> <strong>for</strong> dur<strong>in</strong>gout-of-school time. However, onlyproviders with assistants can <strong>care</strong><strong>for</strong> more than eight <strong>child</strong>ren atone time. 10The tables also <strong>in</strong>dicate the numberof known license-exempt homeproviders and their available slots.As mentioned, license-exempt homeproviders are a much more elusivegroup to gather statistics on. NeitherDCFS nor the Ill<strong>in</strong>ois <strong>Action</strong> <strong>for</strong><strong>Children</strong> Resource and ReferralProgram has significant <strong>in</strong><strong>for</strong>mationon license-exempt home providers,although we learn more aboutthis group every year through theResource and Referral Program.We know most about those licenseexempthome providers who receivepayments from CCAP <strong>for</strong> provid<strong>in</strong>g<strong>child</strong> <strong>care</strong> to low-<strong>in</strong>come work<strong>in</strong>gfamilies, so those are the ones wereport on here.In 2009, some 34,600 Cook Countylicense-exempt home providersreceived CCAP payments dur<strong>in</strong>g atleast one month of the year, thoughfewer participate at any one time.In June 2009, there were 17,451license-exempt home <strong>child</strong> <strong>care</strong>providers receiv<strong>in</strong>g CCAP payments.Home providers who have licenseexemptstatus may legally <strong>care</strong> <strong>for</strong>as many as three <strong>child</strong>ren who arenot their own. 11 While we provisionallyestimate 52,353 slots <strong>in</strong> knownlicense-exempt homes <strong>in</strong> Table II-2,the reader should be aware thatmany, though not all, license-exempthome providers do not offer <strong>child</strong><strong>care</strong> slots <strong>in</strong> the same way thatcenters and licensed homes do.Instead, many are relatives, neighborsor family friends who chooseto <strong>care</strong> <strong>for</strong> particular <strong>child</strong>ren <strong>for</strong>particular periods of time rather thanoffer <strong>care</strong> to any <strong>child</strong> as part ofan ongo<strong>in</strong>g bus<strong>in</strong>ess.B.WHERE ARE THEPROVIDERS AND SLOTS?Some parents will have a moredifficult time f<strong>in</strong>d<strong>in</strong>g <strong>child</strong> <strong>care</strong>because of where they live. The120,005 spaces <strong>in</strong> <strong>child</strong> <strong>care</strong>centers are almost evenly dividedbetween Chicago and suburbanCook County, though there aresome differences. School ageprograms are more abundant,or at least better reported, <strong>in</strong> thesuburbs, while summer-onlyprograms are more abundant,or better reported, <strong>in</strong> Chicago.Two-thirds of the 36,383 licensedhome spaces are located <strong>in</strong>Chicago. Table II-3 shows howcenter and licensed home slotsare distributed throughout theregions of Cook County.Table II-4 presents the distributionof the 52,353 known license-exempthome slots. Aga<strong>in</strong>, these datarepresent only a portion of theactual number of license-exempthome providers—those serv<strong>in</strong>gfamilies us<strong>in</strong>g CCAP. We know,however, that license-exempt <strong>care</strong>is used widely across all <strong>in</strong>comes.Seventy-eight (78) percent of thelicense-exempt home providers15
The 2010 Report of Child Care <strong>in</strong> Cook CountyTable II-3. Full-Time and School Age Child Care Slots <strong>in</strong>Cook County RegionsIncludes daytime slots only.Source: Ill<strong>in</strong>ois <strong>Action</strong> <strong>for</strong> <strong>Children</strong> Resource and Referral Program and DCFS, June 2009N & NW West S & SWN & NW C & W S & SW Suburban Suburban SuburbanProgram Type Chicago Chicago Chicago Cook Cook CookChild Care Centers 11,625 12,116 19,228 18,610 7,738 17,026School Age Only Programs 1,676 1,487 2,005 6,056 1,128 2,085Summer Only Programs 3,700 3,115 6,735 3,177 665 1,833Licensed Homes 2,977 4,658 11,950 1,793 2,566 5,405Licensed Homes—additional school age slots 809 1,122 3,127 266 580 1,130Total Center andLicensed Home Slots 20,787 22,498 43,045 29,902 12,677 27,479Total Slots as a Percentof <strong>Children</strong> Under Age 13 12% 17% 17% 14% 13% 18%Table II-4. License-Exempt Home Child Care SlotsSource: Ill<strong>in</strong>ois Child Care Assistance Program, June 2009N & NW West S & SWN & NW C & W S & SW Suburban Suburban SuburbanProgram Type Chicago Chicago Chicago Cook Cook CookTotal 3,366 13,071 24,306 1,218 2,835 7,557Home of Non-Relative 621 2,097 3,879 228 459 1,314Relative’s Home 1,275 5,349 9,774 477 1,233 3,159Non-Relative <strong>in</strong> Child’s Home 558 2,442 4,662 183 411 1,272Relative <strong>in</strong> Child’s Home 912 3,183 5,991 330 732 1,812participat<strong>in</strong>g <strong>in</strong> CCAP are located<strong>in</strong> Chicago. The table shows thenumerical concentration of theseslots <strong>in</strong> Chicago’s South and South -western and Central and West regions,mirror<strong>in</strong>g the distribution of low<strong>in</strong>comefamilies who are eligible <strong>for</strong>CCAP. Of the suburban licenseexempthome slots, 65 percent fallwith<strong>in</strong> the South and Southwesternsuburban region.License-exempt home <strong>care</strong> canbe broken down further <strong>in</strong>to <strong>care</strong>provided by relatives versus nonrelativesand <strong>care</strong> provided <strong>in</strong> the<strong>child</strong>’s home versus the provider’shome. Table II-4 shows the distributionof these four types of licenseexempthome <strong>care</strong> <strong>for</strong> the sixCook County regions.Maps 1 and 2 show how centerand licensed home slots addedtogether are spread among the<strong>in</strong>dividual communities of CookCounty. License-exempt home slotsare not <strong>in</strong>cluded here because thedata we have provide only a portionof a widely unknown supply andbecause the supply of licenseexempthome <strong>care</strong> is more variablethan licensed <strong>care</strong> as we expla<strong>in</strong>edearlier <strong>in</strong> this section. 12 Whileproviders have more <strong>child</strong> <strong>care</strong>slots <strong>in</strong> Chicago than <strong>in</strong> suburbanCook County overall, the numberof slots varies substantially <strong>in</strong><strong>in</strong>dividual suburban communitiesand Chicago neighborhoods.16


