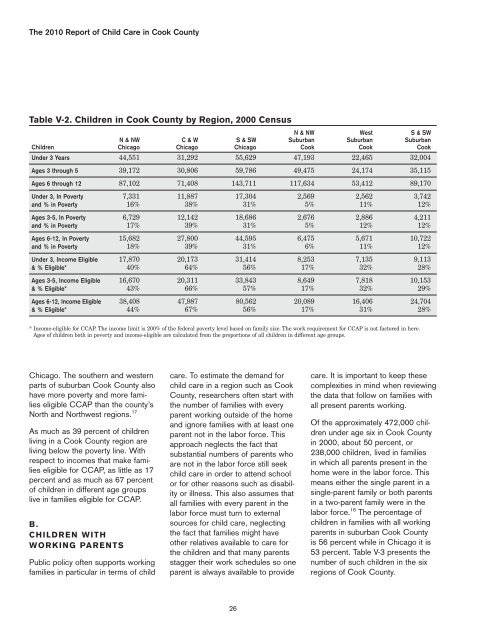
V. Public Dilemma: Who Needs ChildCare? Who Needs Support?The public sector <strong>in</strong> Ill<strong>in</strong>ois facesits own dilemmas <strong>in</strong> help<strong>in</strong>g familiesaddress their <strong>child</strong> <strong>care</strong> needs,particularly <strong>in</strong> decid<strong>in</strong>g how manyresources should be devoted tosupport<strong>in</strong>g families’ <strong>child</strong> <strong>care</strong>needs <strong>in</strong> comparison to other criticalneeds. In consider<strong>in</strong>g this issue, thepublic must decide who needs <strong>child</strong><strong>care</strong>, how much <strong>child</strong> <strong>care</strong> the publicshould support, what k<strong>in</strong>d of <strong>care</strong>to support, and who needs assistancepay<strong>in</strong>g <strong>for</strong> <strong>child</strong> <strong>care</strong>.The majority of data presented <strong>in</strong> thissection are from the 2000 Census,and over the last n<strong>in</strong>e years populationsmay have shifted somewhat.These data should be used moreas an impression of where families,<strong>child</strong>ren, and poverty are <strong>in</strong> CookCounty <strong>in</strong> 2009, rather than as anexact count.A. CHILD POPULATION,POVERTY AND LOW INCOMETable V-1. <strong>Children</strong> <strong>in</strong> Cook County, 2000 Census<strong>Children</strong> Chicago Total Suburban Cook Total Total Cook CountyUnder 3 Years 131,472 101,662 233,134Ages 3 through 5 129,764 108,764 238,528Ages 6 through 12 302,221 260,216 562,437Totals 563,457 470,642 1,034,099Under 3, In Poverty 36,522 8,873 45,395% of Age Group <strong>in</strong> Poverty 28% 9% 19%Ages 3-5, In Poverty 37,557 9,773 47,330% of Age Group <strong>in</strong> Poverty 29% 9% 20%Ages 6-12, In Poverty 88,077 22,868 110,945% of Age Group <strong>in</strong> Poverty 29% 9% 20%Under 3, Income Eligible* 69,457 24,502 93,959% of Age Group Eligible* 53% 24% 40%Ages 3-5, Income Eligible* 70,824 26,619 97,443% of Age Group Eligible* 55% 24% 41%Ages 6-12, Income Eligible 166,957 61,200 228,157% of Age Group Eligible* 55% 24% 41%* Income-eligible <strong>for</strong> CCAP. The <strong>in</strong>come limit is 200% of the federal poverty level based on family size.The work requirement <strong>for</strong> CCAP is not factored <strong>in</strong> here. Ages of <strong>child</strong>ren both <strong>in</strong> poverty and<strong>in</strong>come-eligible are calculated from the proportions of all <strong>child</strong>ren <strong>in</strong> different age groups.More than one million <strong>child</strong>renages 12 and under reside <strong>in</strong> CookCounty. The first four rows of TableV-1 categorize <strong>child</strong>ren <strong>in</strong> Chicagoand suburban Cook County by agegroups based on the U.S. Census2000. As the table shows, morethan 54 percent of the <strong>child</strong>ren <strong>in</strong>Cook County <strong>in</strong> 2000 resided <strong>in</strong>Chicago. Potentially all of the <strong>child</strong>renage 5 and under need <strong>child</strong><strong>care</strong> or early education. Similarly,many older <strong>child</strong>ren ages 6 through12 need be<strong>for</strong>e- or after-school<strong>care</strong>. It is unrealistic, however, tosuppose that the parents of allthese <strong>child</strong>ren actually seek <strong>care</strong>.The next six rows of Table V-1 showlevels of poverty among <strong>child</strong>ren <strong>in</strong>Cook County, <strong>in</strong>dicat<strong>in</strong>g that up to29 percent of the <strong>child</strong>ren <strong>in</strong>Chicago were liv<strong>in</strong>g <strong>in</strong> poverty <strong>in</strong>2000. Chicago <strong>child</strong>ren were morethan three times as likely to live <strong>in</strong>poverty than other Cook County<strong>child</strong>ren. Because poverty rateshave risen s<strong>in</strong>ce 2000, the rates <strong>for</strong>both regions are now likely higherthan the table <strong>in</strong>dicates.The f<strong>in</strong>al six rows of Table V-1 pre -sent the number of <strong>child</strong>ren liv<strong>in</strong>g <strong>in</strong>families whose <strong>in</strong>comes make themeligible <strong>in</strong> 2009 <strong>for</strong> Ill<strong>in</strong>ois ChildCare Assistance (CCAP). In Ill<strong>in</strong>ois,a family’s <strong>in</strong>come can rise 100 percentabove the federal poverty levelbe<strong>for</strong>e the family is no longer eligible<strong>for</strong> assistance. Under this standard,slightly more than half of Chicago<strong>child</strong>ren under age 13 and almostone-quarter of suburban <strong>child</strong>ren<strong>in</strong> Cook County are <strong>in</strong>come-eligible<strong>for</strong> CCAP. Note that <strong>in</strong> addition tothe <strong>in</strong>come requirement, CCAP alsorequires that all parents present <strong>in</strong>the family be <strong>in</strong> the labor <strong>for</strong>ce or<strong>in</strong> education or tra<strong>in</strong><strong>in</strong>g programs.Work<strong>in</strong>g parents are discussed <strong>in</strong>section B below.Table V-2 breaks down the same<strong>in</strong><strong>for</strong>mation on <strong>child</strong> population,poverty and low <strong>in</strong>come <strong>for</strong> thesix regions of the <strong>county</strong>. Families<strong>in</strong> poverty and families with low<strong>in</strong>comes tend to concentrate <strong>in</strong>the western and southern parts of25
The 2010 Report of Child Care <strong>in</strong> Cook CountyTable V-2. <strong>Children</strong> <strong>in</strong> Cook County by Region, 2000 CensusN & NW West S & SWN & NW C & W S & SW Suburban Suburban Suburban<strong>Children</strong> Chicago Chicago Chicago Cook Cook CookUnder 3 Years 44,551 31,292 55,629 47,193 22,465 32,004Ages 3 through 5 39,172 30,806 59,786 49,475 24,174 35,115Ages 6 through 12 87,102 71,408 143,711 117,634 53,412 89,170Under 3, In Poverty 7,331 11,887 17,304 2,569 2,562 3,742and % <strong>in</strong> Poverty 16% 38% 31% 5% 11% 12%Ages 3-5, In Poverty 6,729 12,142 18,686 2,676 2,886 4,211and % <strong>in</strong> Poverty 17% 39% 31% 5% 12% 12%Ages 6-12, In Poverty 15,682 27,800 44,595 6,475 5,671 10,722and % <strong>in</strong> Poverty 18% 39% 31% 6% 11% 12%Under 3, Income Eligible 17,870 20,173 31,414 8,253 7,135 9,113& % Eligible* 40% 64% 56% 17% 32% 28%Ages 3-5, Income Eligible 16,670 20,311 33,843 8,649 7,818 10,153& % Eligible* 43% 66% 57% 17% 32% 29%Ages 6-12, Income Eligible 38,408 47,987 80,562 20,089 16,406 24,704& % Eligible* 44% 67% 56% 17% 31% 28%* Income-eligible <strong>for</strong> CCAP. The <strong>in</strong>come limit is 200% of the federal poverty level based on family size. The work requirement <strong>for</strong> CCAP is not factored <strong>in</strong> here.Ages of <strong>child</strong>ren both <strong>in</strong> poverty and <strong>in</strong>come-eligible are calculated from the proportions of all <strong>child</strong>ren <strong>in</strong> different age groups.Chicago. The southern and westernparts of suburban Cook County alsohave more poverty and more familieseligible CCAP than the <strong>county</strong>’sNorth and Northwest regions. 17As much as 39 percent of <strong>child</strong>renliv<strong>in</strong>g <strong>in</strong> a Cook County region areliv<strong>in</strong>g below the poverty l<strong>in</strong>e. Withrespect to <strong>in</strong>comes that make familieseligible <strong>for</strong> CCAP, as little as 17percent and as much as 67 percentof <strong>child</strong>ren <strong>in</strong> different age groupslive <strong>in</strong> families eligible <strong>for</strong> CCAP.B.CHILDREN WITHWORKING PARENTSPublic policy often supports work<strong>in</strong>gfamilies <strong>in</strong> particular <strong>in</strong> terms of <strong>child</strong><strong>care</strong>. To estimate the demand <strong>for</strong><strong>child</strong> <strong>care</strong> <strong>in</strong> a region such as CookCounty, researchers often start withthe number of families with everyparent work<strong>in</strong>g outside of the homeand ignore families with at least oneparent not <strong>in</strong> the labor <strong>for</strong>ce. Thisapproach neglects the fact thatsubstantial numbers of parents whoare not <strong>in</strong> the labor <strong>for</strong>ce still seek<strong>child</strong> <strong>care</strong> <strong>in</strong> order to attend schoolor <strong>for</strong> other reasons such as disabilityor illness. This also assumes thatall families with every parent <strong>in</strong> thelabor <strong>for</strong>ce must turn to externalsources <strong>for</strong> <strong>child</strong> <strong>care</strong>, neglect<strong>in</strong>gthe fact that families might haveother relatives available to <strong>care</strong> <strong>for</strong>the <strong>child</strong>ren and that many parentsstagger their work schedules so oneparent is always available to provide<strong>care</strong>. It is important to keep thesecomplexities <strong>in</strong> m<strong>in</strong>d when review<strong>in</strong>gthe data that follow on families withall present parents work<strong>in</strong>g.Of the approximately 472,000 <strong>child</strong>renunder age six <strong>in</strong> Cook County<strong>in</strong> 2000, about 50 percent, or238,000 <strong>child</strong>ren, lived <strong>in</strong> families<strong>in</strong> which all parents present <strong>in</strong> thehome were <strong>in</strong> the labor <strong>for</strong>ce. Thismeans either the s<strong>in</strong>gle parent <strong>in</strong> as<strong>in</strong>gle-parent family or both parents<strong>in</strong> a two-parent family were <strong>in</strong> thelabor <strong>for</strong>ce. 18 The percentage of<strong>child</strong>ren <strong>in</strong> families with all work<strong>in</strong>gparents <strong>in</strong> suburban Cook Countyis 56 percent while <strong>in</strong> Chicago it is53 percent. Table V-3 presents thenumber of such <strong>child</strong>ren <strong>in</strong> the sixregions of Cook County.26


