child care in cook county - Illinois Action for Children
child care in cook county - Illinois Action for Children
child care in cook county - Illinois Action for Children

Create successful ePaper yourself
Turn your PDF publications into a flip-book with our unique Google optimized e-Paper software.
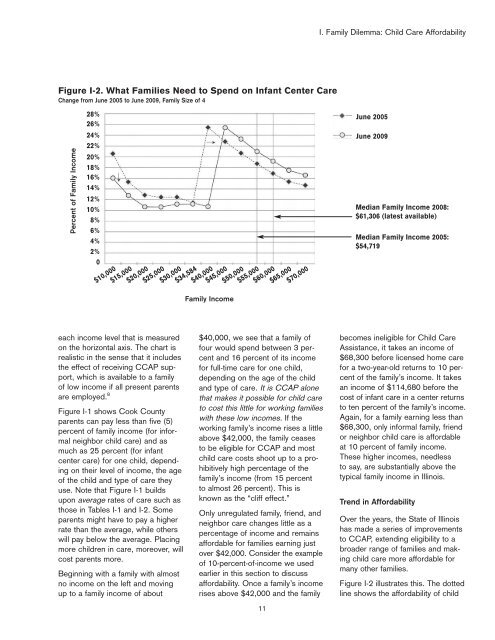
I. Family Dilemma: Child Care Af<strong>for</strong>dabilityFigure I-2. What Families Need to Spend on Infant Center CareChange from June 2005 to June 2009, Family Size of 428%26%24%22%20%18%16%14%12%10%8%6%4%2%0June 2005Percent of Family Income$10,000$15,000$20,000$25,000$30,000$34,584$40,000$45,000Family Income$50,000$55,000$60,000$65,000$70,000June 2009Median Family Income 2008:$61,306 (latest available)Median Family Income 2005:$54,719each <strong>in</strong>come level that is measuredon the horizontal axis. The chart isrealistic <strong>in</strong> the sense that it <strong>in</strong>cludesthe effect of receiv<strong>in</strong>g CCAP support,which is available to a familyof low <strong>in</strong>come if all present parentsare employed. 8Figure I-1 shows Cook Countyparents can pay less than five (5)percent of family <strong>in</strong>come (<strong>for</strong> <strong>in</strong><strong>for</strong>malneighbor <strong>child</strong> <strong>care</strong>) and asmuch as 25 percent (<strong>for</strong> <strong>in</strong>fantcenter <strong>care</strong>) <strong>for</strong> one <strong>child</strong>, depend<strong>in</strong>gon their level of <strong>in</strong>come, the ageof the <strong>child</strong> and type of <strong>care</strong> theyuse. Note that Figure I-1 buildsupon average rates of <strong>care</strong> such asthose <strong>in</strong> Tables I-1 and I-2. Someparents might have to pay a higherrate than the average, while otherswill pay below the average. Plac<strong>in</strong>gmore <strong>child</strong>ren <strong>in</strong> <strong>care</strong>, moreover, willcost parents more.Beg<strong>in</strong>n<strong>in</strong>g with a family with almostno <strong>in</strong>come on the left and mov<strong>in</strong>gup to a family <strong>in</strong>come of about$40,000, we see that a family offour would spend between 3 percentand 16 percent of its <strong>in</strong>come<strong>for</strong> full-time <strong>care</strong> <strong>for</strong> one <strong>child</strong>,depend<strong>in</strong>g on the age of the <strong>child</strong>and type of <strong>care</strong>. It is CCAP alonethat makes it possible <strong>for</strong> <strong>child</strong> <strong>care</strong>to cost this little <strong>for</strong> work<strong>in</strong>g familieswith these low <strong>in</strong>comes. If thework<strong>in</strong>g family’s <strong>in</strong>come rises a littleabove $42,000, the family ceasesto be eligible <strong>for</strong> CCAP and most<strong>child</strong> <strong>care</strong> costs shoot up to a prohibitivelyhigh percentage of thefamily’s <strong>in</strong>come (from 15 percentto almost 26 percent). This isknown as the “cliff effect.”Only unregulated family, friend, andneighbor <strong>care</strong> changes little as apercentage of <strong>in</strong>come and rema<strong>in</strong>saf<strong>for</strong>dable <strong>for</strong> families earn<strong>in</strong>g justover $42,000. Consider the exampleof 10-percent-of-<strong>in</strong>come we usedearlier <strong>in</strong> this section to discussaf<strong>for</strong>dability. Once a family’s <strong>in</strong>comerises above $42,000 and the family11becomes <strong>in</strong>eligible <strong>for</strong> Child CareAssistance, it takes an <strong>in</strong>come of$68,300 be<strong>for</strong>e licensed home <strong>care</strong><strong>for</strong> a two-year-old returns to 10 percentof the family’s <strong>in</strong>come. It takesan <strong>in</strong>come of $114,680 be<strong>for</strong>e thecost of <strong>in</strong>fant <strong>care</strong> <strong>in</strong> a center returnsto ten percent of the family’s <strong>in</strong>come.Aga<strong>in</strong>, <strong>for</strong> a family earn<strong>in</strong>g less than$68,300, only <strong>in</strong><strong>for</strong>mal family, friendor neighbor <strong>child</strong> <strong>care</strong> is af<strong>for</strong>dableat 10 percent of family <strong>in</strong>come.These higher <strong>in</strong>comes, needlessto say, are substantially above thetypical family <strong>in</strong>come <strong>in</strong> Ill<strong>in</strong>ois.Trend <strong>in</strong> Af<strong>for</strong>dabilityOver the years, the State of Ill<strong>in</strong>oishas made a series of improvementsto CCAP, extend<strong>in</strong>g eligibility to abroader range of families and mak<strong>in</strong>g<strong>child</strong> <strong>care</strong> more af<strong>for</strong>dable <strong>for</strong>many other families.Figure I-2 illustrates this. The dottedl<strong>in</strong>e shows the af<strong>for</strong>dability of <strong>child</strong>