Seismic 2D Reflection Processing and Interpretation of ... - Posiva
Seismic 2D Reflection Processing and Interpretation of ... - Posiva
Seismic 2D Reflection Processing and Interpretation of ... - Posiva

You also want an ePaper? Increase the reach of your titles
YUMPU automatically turns print PDFs into web optimized ePapers that Google loves.
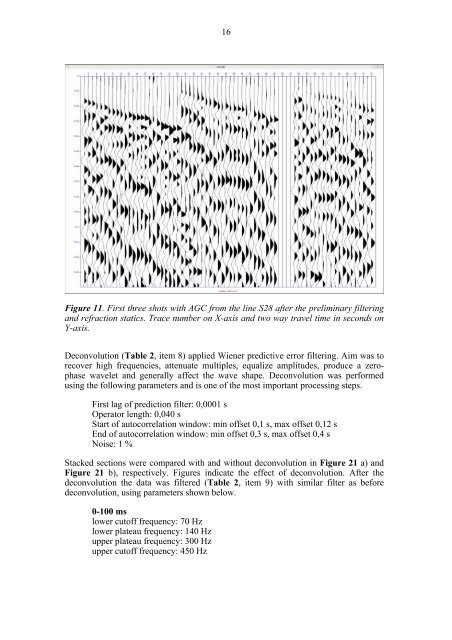
16Figure 11. First three shots with AGC from the line S28 after the preliminary filtering<strong>and</strong> refraction statics. Trace number on X-axis <strong>and</strong> two way travel time in seconds onY-axis.Deconvolution (Table 2, item 8) applied Wiener predictive error filtering. Aim was torecover high frequencies, attenuate multiples, equalize amplitudes, produce a zerophasewavelet <strong>and</strong> generally affect the wave shape. Deconvolution was performedusing the following parameters <strong>and</strong> is one <strong>of</strong> the most important processing steps.First lag <strong>of</strong> prediction filter: 0,0001 sOperator length: 0,040 sStart <strong>of</strong> autocorrelation window: min <strong>of</strong>fset 0,1 s, max <strong>of</strong>fset 0,12 sEnd <strong>of</strong> autocorrelation window: min <strong>of</strong>fset 0,3 s, max <strong>of</strong>fset 0,4 sNoise: 1 %Stacked sections were compared with <strong>and</strong> without deconvolution in Figure 21 a) <strong>and</strong>Figure 21 b), respectively. Figures indicate the effect <strong>of</strong> deconvolution. After thedeconvolution the data was filtered (Table 2, item 9) with similar filter as beforedeconvolution, using parameters shown below.0-100 mslower cut<strong>of</strong>f frequency: 70 Hzlower plateau frequency: 140 Hzupper plateau frequency: 300 Hzupper cut<strong>of</strong>f frequency: 450 Hz