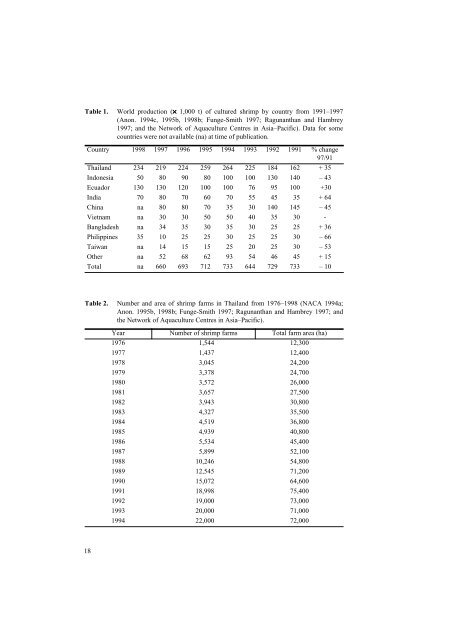
! !Table 1. World production (# 1,000 t) of cultured shrimp by country from 1991–1997(Anon. 1994c, 1995b, 1998b; Funge-Smith 1997; Ragunanthan and Hambrey1997; and the Network of <strong>Aquaculture</strong> Centres <strong>in</strong> Asia–Pacific). Data <strong>for</strong> somecountries were not available (na) at time of publication.Country 1998 1997 1996 1995 1994 1993 1992 1991 % change97/91<strong>Thailand</strong>234 219 224 259 264 225 184 162 + 35Indonesia 50 80 90 80 100 100 130 140 – 43Ecuador 130 130 120 100 100 76 95 100 +30India 70 80 70 60 70 55 45 35 + 64Ch<strong>in</strong>a na 80 80 70 35 30 140 145 – 45Vietnam na 30 30 50 50 40 35 30 -Bangladesh na 34 35 30 35 30 25 25 + 36Philipp<strong>in</strong>es 35 10 25 25 30 25 25 30 – 66Taiwan na 14 15 15 25 20 25 30 – 53Other na 52 68 62 93 54 46 45 + 15Total na 660 693 712 733 644 729 733 – 10Table 2. Number and area of shrimp farms <strong>in</strong> <strong>Thailand</strong> from 1976–1998 (NACA 1994a;Anon. 1995b, 1998b; Funge-Smith 1997; Ragunanthan and Hambrey 1997; andthe Network of <strong>Aquaculture</strong> Centres <strong>in</strong> Asia–Pacific).Year Number of shrimp farms Total farm area (ha)1976 1,544 12,3001977 1,437 12,4001978 3,045 24,2001979 3,378 24,7001980 3,572 26,0001981 3,657 27,5001982 3,943 30,8001983 4,327 35,5001984 4,519 36,8001985 4,939 40,8001986 5,534 45,4001987 5,899 52,1001988 10,246 54,8001989 12,545 71,2001990 15,072 64,6001991 18,998 75,4001992 19,000 73,0001993 20,000 71,0001994 22,000 72,000)'
!Table 2. (cont’d) Number and area of shrimp farms <strong>in</strong> <strong>Thailand</strong> from 1976–1998 (NACA1994a; Anon. 1995b, 1998b; Funge-Smith 1997; Ragunanthan and Hambrey 1997;and the Network of <strong>Aquaculture</strong> Centres <strong>in</strong> Asia–Pacific).1995 26,000 74,0001996 22,000 69,0001997 21,000 69,0001998 22,500 70,400Table 3.Total mar<strong>in</strong>e shrimp production <strong>in</strong> <strong>Thailand</strong> from 1972–1998, and the quantitiesand percentage produced by aquaculture and sea capture <strong>for</strong> each year (NACA1994b). <strong>Aquaculture</strong> production of shrimp <strong>in</strong> tonnes from 1992–1998 (Anon.1994c, 1995b, 1998a,b; Funge-Smith 1997; Ragunanthan and Hambrey 1997) (na= data not available).YearTotalproductionProduction fromcaptureProduction fromculture% of productionfrom culture1972 67,878 66,887 991 1.51973 79,160 77,525 1,635 2.01974 81,868 80,093 1,775 2.11975 87,039 84,501 2,538 2.91976 88,677 86,139 2,538 2.81977 118,953 117,363 1,590 1.31978 127,404 121,009 6,395 5.01979 116,456 109,392 7,064 6.11980 118,340 110,277 8,063 6.81981 133,435 122,707 10,728 8.01982 166,614 156,523 10,091 6.01983 139,134 127,584 11,550 8.31984 117,401 104,393 13,007 11.11985 107,472 91,631 15,841 14.81986 120,413 102,413 17,886 14.81987 129,777 106,211 23,566 18.11988 141,503 85,870 55,633 39.31989 178,699 85,204 93,495 52.31990 200,724 82,497 118,227 58.71991 268,565 106,495 162,070 60.31992 276,500 91,616 184,884 66.91993 321,085 95,571 225,514 70.21994 363,446 100,000 263,945 72.51995 364,540 105,000 259,540 71.21996 364,000 140,000 224,000 61.51997 349,000 130,000 219,000 62.81998 na na 234,000 na)(
- Page 8 and 9: !The 1994 Workshop had a working hy
- Page 11 and 12: !The Workshop at Hat Yai, SongkhlaA
- Page 13 and 14: !ReferenceSmith, P.T., ed.. 1999. T
- Page 15 and 16: !Shrimp Farming in ThailandOver the
- Page 20 and 21: !Domestic and world demandJapan is
- Page 22 and 23: !Intensification of farms has been
- Page 24 and 25: !no significant difference between
- Page 26 and 27: !Production Practices and Technique
- Page 28 and 29: !use water which is almost fresh (F
- Page 30 and 31: !mended quantities for application
- Page 32 and 33: !the biological processes in sedime
- Page 34 and 35: !factors (Fegan 1994). Environmenta
- Page 36 and 37: !Acid sulphate soils occur in most
- Page 38 and 39: during the rainy season, some deter
- Page 40 and 41: Land subsidenceCoastal land subside
- Page 42 and 43: first when an area becomes environm
- Page 44 and 45: !Administration. Their work has inv
- Page 46 and 47: agriculture, selects coastal land p
- Page 48 and 49: Sustainability, Sustainable Develop
- Page 50 and 51: cultural and environmental asset va
- Page 52 and 53: $+Table 12. (cont’d) Impediments
- Page 54 and 55: $#Table 12. (cont’d) Impediments
- Page 56 and 57: $%Table 12. (cont’d) Impediments
- Page 58 and 59: capacities of alternative organisms
- Page 60 and 61: sources. This is one of the greates
- Page 62 and 63: Table 13. (cont’d) Summary of the
- Page 64 and 65: Boonyapiwat, S. 1989. Species of ph
- Page 66 and 67: Katesombun, B. 1992. Aquaculture pr
- Page 68 and 69:
Sirisup, S. 1988 Socio-economic cha
- Page 70 and 71:
!In the preliminary analysis, the s
- Page 72 and 73:
!until all variables had been teste
- Page 74 and 75:
!quality problem over the past 3 ye
- Page 76 and 77:
!Figure 1. Characterisation of prov
- Page 78 and 79:
!Variables Contributing to Shrimp P
- Page 80 and 81:
!Figure 5. Relationship between ave
- Page 82 and 83:
!southern). The linear regression m
- Page 84 and 85:
!Appendix. Results of logistic regr
- Page 86 and 87:
!2) Trat ProvinceClassification tab
- Page 88 and 89:
!Chi-square df significanceModel Ch
- Page 90 and 91:
!8) Satun ProvinceClassification ta
- Page 92 and 93:
!Variables in the equationConstant
- Page 94 and 95:
!A total of 49 participants were in
- Page 96 and 97:
! ! ! ! ! ! ! ! ! ! ! ! ! ! ! ! !Fi
- Page 98 and 99:
!All issues are listed in Appendice
- Page 100 and 101:
!!were short term and one issue was
- Page 102 and 103:
!reared broodstock (issue 71). They
- Page 104 and 105:
!!Two participants commented that i
- Page 106 and 107:
mation transfer and training. This
- Page 108 and 109:
108Appendix 1. (cont’d) Descripti
- Page 110 and 111:
110Appendix 1. (cont’d) Descripti
- Page 112 and 113:
112Appendix 2. Descriptive statisti
- Page 114 and 115:
114Appendix 2. (cont’d) Descripti
- Page 116 and 117:
116Appendix 3. Descriptive statisti
- Page 118 and 119:
118Appendix 4. Descriptive statisti
- Page 120 and 121:
120Appendix 5. Descriptive statisti
- Page 122 and 123:
Appendix 5. (cont’d) Descriptive
- Page 124 and 125:
Appendix 7. Descriptive statistics
- Page 126 and 127:
Appendix 7. (cont’d) Descriptive
- Page 128 and 129:
128Appendix 8. (cont’d) Descripti
- Page 130 and 131:
!ParticipantsAustraliaDr Paul T. Sm