Noise generated by cavitating single-hole and multi-hole orifices in ...
Noise generated by cavitating single-hole and multi-hole orifices in ...
Noise generated by cavitating single-hole and multi-hole orifices in ...

Create successful ePaper yourself
Turn your PDF publications into a flip-book with our unique Google optimized e-Paper software.
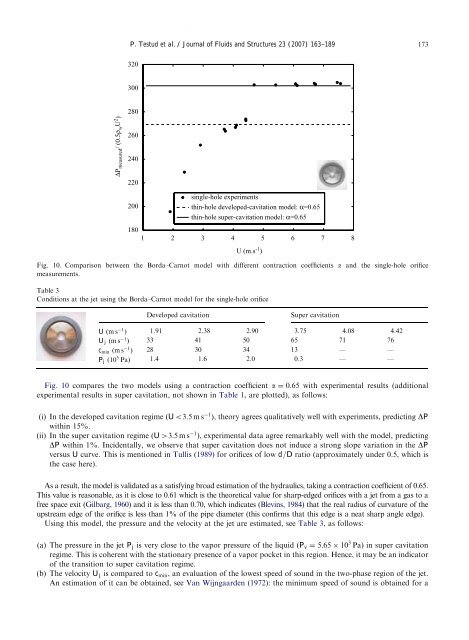
ARTICLE IN PRESSP. Testud et al. / Journal of Fluids <strong>and</strong> Structures 23 (2007) 163–189 173320300280∆P measured / (0.5ρ w U 2 )260240220200<strong>s<strong>in</strong>gle</strong>-<strong>hole</strong> experimentsth<strong>in</strong>-<strong>hole</strong> developed-cavitation model: α=0.65th<strong>in</strong>-<strong>hole</strong> super-cavitation model: α=0.651801 2 3 4 5 6 7 8U (m.s -1 )Fig. 10. Comparison between the Borda–Carnot model with different contraction coefficients a <strong>and</strong> the <strong>s<strong>in</strong>gle</strong>-<strong>hole</strong> orificemeasurements.Table 3Conditions at the jet us<strong>in</strong>g the Borda–Carnot model for the <strong>s<strong>in</strong>gle</strong>-<strong>hole</strong> orificeDeveloped cavitationSuper cavitationU ðms 1 Þ 1.91 2.38 2.90 3.75 4.08 4.42U j ðms 1 Þ 33 41 50 65 71 76c m<strong>in</strong> ðms 1 Þ 28 30 34 13 — —P j ð10 5 PaÞ 1.4 1.6 2.0 0.3 — —Fig. 10 compares the two models us<strong>in</strong>g a contraction coefficient a ¼ 0:65 with experimental results (additionalexperimental results <strong>in</strong> super cavitation, not shown <strong>in</strong> Table 1, are plotted), as follows:(i) In the developed cavitation regime ðUo3:5ms 1 Þ, theory agrees qualitatively well with experiments, predict<strong>in</strong>g DPwith<strong>in</strong> 15%.(ii) In the super cavitation regime ðU43:5ms 1 Þ, experimental data agree remarkably well with the model, predict<strong>in</strong>gDP with<strong>in</strong> 1%. Incidentally, we observe that super cavitation does not <strong>in</strong>duce a strong slope variation <strong>in</strong> the DPversus U curve. This is mentioned <strong>in</strong> Tullis (1989) for <strong>orifices</strong> of low d=D ratio (approximately under 0.5, which isthe case here).As a result, the model is validated as a satisfy<strong>in</strong>g broad estimation of the hydraulics, tak<strong>in</strong>g a contraction coefficient of 0.65.This value is reasonable, as it is close to 0.61 which is the theoretical value for sharp-edged <strong>orifices</strong> with a jet from a gas to afree space exit (Gilbarg, 1960) <strong>and</strong> it is less than 0.70, which <strong>in</strong>dicates (Blev<strong>in</strong>s, 1984) that the real radius of curvature of theupstream edge of the orifice is less than 1% of the pipe diameter (this confirms that this edge is a neat sharp angle edge).Us<strong>in</strong>g this model, the pressure <strong>and</strong> the velocity at the jet are estimated, see Table 3, as follows:(a) The pressure <strong>in</strong> the jet P j is very close to the vapor pressure of the liquid ðP v ¼ 5:65 10 3 PaÞ <strong>in</strong> super cavitationregime. This is coherent with the stationary presence of a vapor pocket <strong>in</strong> this region. Hence, it may be an <strong>in</strong>dicatorof the transition to super cavitation regime.(b) The velocity U j is compared to c m<strong>in</strong> , an evaluation of the lowest speed of sound <strong>in</strong> the two-phase region of the jet.An estimation of it can be obta<strong>in</strong>ed, see Van Wijngaarden (1972): the m<strong>in</strong>imum speed of sound is obta<strong>in</strong>ed for a