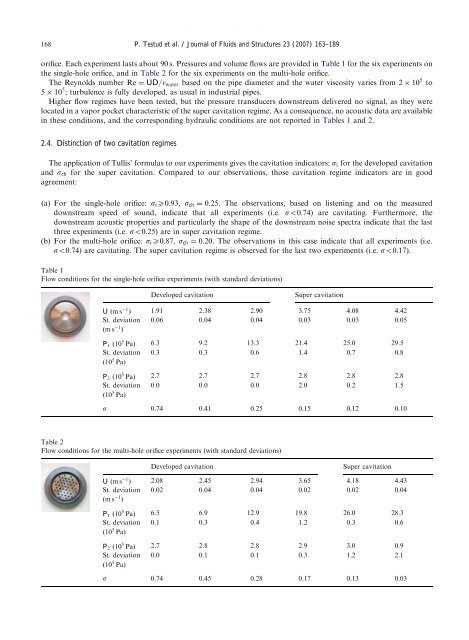
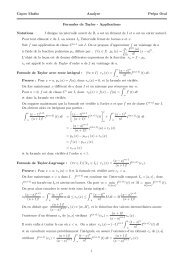
ARTICLE IN PRESS168P. Testud et al. / Journal of Fluids <strong>and</strong> Structures 23 (2007) 163–189orifice. Each experiment lasts about 90 s. Pressures <strong>and</strong> volume flows are provided <strong>in</strong> Table 1 for the six experiments onthe <strong>s<strong>in</strong>gle</strong>-<strong>hole</strong> orifice, <strong>and</strong> <strong>in</strong> Table 2 for the six experiments on the <strong>multi</strong>-<strong>hole</strong> orifice.The Reynolds number Re ¼ UD=n water based on the pipe diameter <strong>and</strong> the water viscosity varies from 2 10 5 to5 10 5 ; turbulence is fully developed, as usual <strong>in</strong> <strong>in</strong>dustrial pipes.Higher flow regimes have been tested, but the pressure transducers downstream delivered no signal, as they werelocated <strong>in</strong> a vapor pocket characteristic of the super cavitation regime. As a consequence, no acoustic data are available<strong>in</strong> these conditions, <strong>and</strong> the correspond<strong>in</strong>g hydraulic conditions are not reported <strong>in</strong> Tables 1 <strong>and</strong> 2.2.4. Dist<strong>in</strong>ction of two cavitation regimesThe application of Tullis’ formulas to our experiments gives the cavitation <strong>in</strong>dicators: s i for the developed cavitation<strong>and</strong> s ch for the super cavitation. Compared to our observations, those cavitation regime <strong>in</strong>dicators are <strong>in</strong> goodagreement:(a) For the <strong>s<strong>in</strong>gle</strong>-<strong>hole</strong> orifice: s i X0:93, s ch ¼ 0:25. The observations, based on listen<strong>in</strong>g <strong>and</strong> on the measureddownstream speed of sound, <strong>in</strong>dicate that all experiments (i.e. so0:74) are <strong>cavitat<strong>in</strong>g</strong>. Furthermore, thedownstream acoustic properties <strong>and</strong> particularly the shape of the downstream noise spectra <strong>in</strong>dicate that the lastthree experiments (i.e. so0:25) are <strong>in</strong> super cavitation regime.(b) For the <strong>multi</strong>-<strong>hole</strong> orifice: s i X0:87, s ch ¼ 0:20. The observations <strong>in</strong> this case <strong>in</strong>dicate that all experiments (i.e.so0:74) are <strong>cavitat<strong>in</strong>g</strong>. The super cavitation regime is observed for the last two experiments (i.e. so0:17).Table 1Flow conditions for the <strong>s<strong>in</strong>gle</strong>-<strong>hole</strong> orifice experiments (with st<strong>and</strong>ard deviations)Developed cavitationSuper cavitationU ðms 1 Þ 1.91 2.38 2.90 3.75 4.08 4.42St. deviation 0.06 0.04 0.04 0.03 0.03 0.05ðms 1 ÞP 1 ð10 5 PaÞ 6.3 9.2 13.3 21.4 25.0 29.5St. deviation 0.3 0.3 0.6 1.4 0.7 0.8ð10 5 PaÞP 2 ð10 5 PaÞ 2.7 2.7 2.7 2.8 2.8 2.8St. deviation 0.0 0.0 0.0 2.0 0.2 1.5ð10 5 PaÞs 0.74 0.41 0.25 0.15 0.12 0.10Table 2Flow conditions for the <strong>multi</strong>-<strong>hole</strong> orifice experiments (with st<strong>and</strong>ard deviations)Developed cavitationSuper cavitationU ðms 1 Þ 2.08 2.45 2.94 3.65 4.18 4.43St. deviation 0.02 0.04 0.04 0.02 0.02 0.04ðms 1 ÞP 1 ð10 5 PaÞ 6.5 6.9 12.9 19.8 26.0 28.3St. deviation 0.1 0.3 0.4 1.2 0.3 0.6ð10 5 PaÞP 2 ð10 5 PaÞ 2.7 2.8 2.8 2.9 3.0 0.9St. deviation 0.0 0.1 0.1 0.3 1.2 2.1ð10 5 PaÞs 0.74 0.45 0.28 0.17 0.13 0.03
2.5. Acoustic analysis methodARTICLE IN PRESSP. Testud et al. / Journal of Fluids <strong>and</strong> Structures 23 (2007) 163–189 169In the frequency range of the study, only acoustic plane waves propagate. The issue is to determ<strong>in</strong>e the spectra p þ <strong>and</strong>p represent<strong>in</strong>g, respectively, the upstream <strong>and</strong> downstream travel<strong>in</strong>g plane waves <strong>and</strong> for which Fourier-like analysisholds.From each experiment, time fluctuat<strong>in</strong>g-pressure signals are obta<strong>in</strong>ed. These data are truncated to a time <strong>in</strong>tervalwhere the acoustic properties do not evolve significantly, i.e. on a duration of about 10 s. With the help of a referencepressure p ref , we compute the cross-spectral densities G ppref ðf Þ, which are def<strong>in</strong>ed as the Fourier Transform of the timecorrelation (Bendat <strong>and</strong> Piersol, 1986). It is worth recall<strong>in</strong>g that, for a small frequency b<strong>and</strong>width Df , the mean-squarevalue of the pressure <strong>in</strong> the frequency range ½f ; f þ Df Š is given <strong>by</strong> G pp ðf Þ Df . These cross-spectra are expressed <strong>in</strong>Pa 2 =Hz. In order to get a spectral expression l<strong>in</strong>ear with the pressure, we choose to use the follow<strong>in</strong>g expression, <strong>in</strong>Pa=Hz 1=2 (see Appendix A for more details):p n ðf Þ¼G p n ðtÞp ref ðtÞðf Þpffiffiffiffiffiffiffiffiffiffiffiffiffiffiffiffiffiffiffiffiffiffiffiffiffiffið1pnp10Þ. (5)G pref ðtÞp ref ðtÞðf ÞFor upstream observations, transducer 1 is chosen as reference, <strong>and</strong> for downstream observations, transducer 10 ischosen as reference.As plane waves propagate, the acoustic pressure at one po<strong>in</strong>t is the summation of the forward (<strong>in</strong> the direction of theflow) travel<strong>in</strong>g wave p þ <strong>and</strong> of the backward travel<strong>in</strong>g wave p . We assume the speed of sound to be identical <strong>in</strong> theforward <strong>and</strong> <strong>in</strong> the backward directions, because the Mach number is low (of the order of 10 3 ). The identification ateach transducer of the local speed of sound <strong>and</strong> of the acoustic plane waves is carried out accord<strong>in</strong>g to st<strong>and</strong>ard<strong>in</strong>tensimetry techniques (Davies et al., 1980; Bode´ n <strong>and</strong> Abom, 1986; Hassis, 1999).The f<strong>in</strong>al spectra represent an average of about 20 spectra, determ<strong>in</strong>ed with a time signal of 10 s duration. Each<strong>in</strong>termediate spectrum is determ<strong>in</strong>ed with a w<strong>in</strong>dow of 1 s duration, <strong>and</strong> the successive w<strong>in</strong>dows have an overlapp<strong>in</strong>gratio of 0.5 (between 0 <strong>and</strong> 1). This average is made <strong>in</strong> order to reduce the r<strong>and</strong>om errors.The use of a <strong>s<strong>in</strong>gle</strong> reference microphone may give uncerta<strong>in</strong>ties for determ<strong>in</strong><strong>in</strong>g st<strong>and</strong><strong>in</strong>g waves if there is a pressurenode at a microphone. This happens when the reflection coefficient is close to unity. At low frequencies (below 500 Hz),this is the case for developed cavitation (see Fig. 6). However, as shown <strong>in</strong> Fig. 19, the microphones are not close to thepressure nodes of the st<strong>and</strong><strong>in</strong>g wave patterns. At higher frequencies, <strong>and</strong> for super cavitation, the reflection coefficient isso low that we do not expect a problem (see Figs. 6 <strong>and</strong> 7).2.6. Acoustic boundary conditions on both sides of the orifice2.6.1. Acoustic boundary conditions upstream of the orificeThe acoustic conditions imposed <strong>by</strong> the test rig upstream of the orifice are quite reflect<strong>in</strong>g, as illustrated <strong>in</strong> Fig. 5 <strong>by</strong>the upstream reflection coefficient R ¼ p =p þ , def<strong>in</strong>ed as the ratio between the forward <strong>and</strong> the backward propagat<strong>in</strong>gplane waves. These reflect<strong>in</strong>g characteristics are due to <strong>multi</strong>ple partial reflections of the acoustic waves on variouselements present on the upstream part of the test rig as an open valve, a few bends <strong>and</strong> section restrictions. Thoseelements have not been modified <strong>in</strong> the course of the experiments, so that these reflect<strong>in</strong>g conditions not vary muchfrom one experiment to another.2.6.2. Acoustic boundary conditions downstream of the orificeThe downstream acoustic boundary condition depends on the cavitation regime, developed cavitation regime orsuper cavitation regime.In developed cavitation regime (see Fig. 6), the downstream reflection coefficient has a magnitude close to 1 up to600 Hz, which <strong>in</strong>dicates a strong reflect<strong>in</strong>g condition. As the phase is a l<strong>in</strong>ear function of the frequency, the reflectionpo<strong>in</strong>t is determ<strong>in</strong>ed: it corresponds to the location of an open valve (at 53D downstream of the orifice). The cavity ofthis valve is hence filled with a very compressible fluid, i.e. air, impos<strong>in</strong>g an acoustic pressure node p 0 ¼ 0.The reflection coefficient shows values above unity <strong>in</strong> Figs. 5 <strong>and</strong> 6. This may be due to measurement <strong>in</strong>accuracies.Also the presence of a noise source outside the ma<strong>in</strong> source region is possible <strong>and</strong> would give values above unity.In the super cavitation regime (see Fig. 7), the downstream reflection coefficient falls down below the value of 0.5. Asa first approximation, the pipe term<strong>in</strong>ation is then almost anechoic. This difference of behavior between the developedcavitation regime <strong>and</strong> the super cavitation regime is not analysed <strong>in</strong> the framework of the present study.This variation of the downstream acoustic boundary conditions is specific of the test rig. It has some impact on thelevels of the downstream spectra. This will be taken <strong>in</strong>to account further <strong>in</strong> the study of the downstream noise spectra.