Noise generated by cavitating single-hole and multi-hole orifices in ...
Noise generated by cavitating single-hole and multi-hole orifices in ...
Noise generated by cavitating single-hole and multi-hole orifices in ...

Create successful ePaper yourself
Turn your PDF publications into a flip-book with our unique Google optimized e-Paper software.
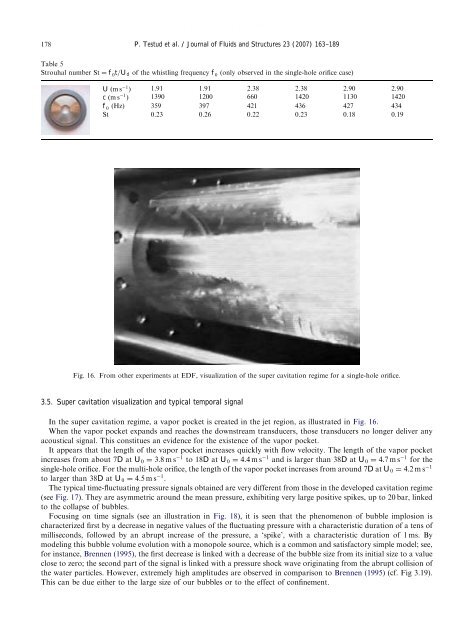
ARTICLE IN PRESS178P. Testud et al. / Journal of Fluids <strong>and</strong> Structures 23 (2007) 163–189Table 5Strouhal number St ¼ f 0 t=U d of the whistl<strong>in</strong>g frequency f 0 (only observed <strong>in</strong> the <strong>s<strong>in</strong>gle</strong>-<strong>hole</strong> orifice case)U ðms 1 Þ 1.91 1.91 2.38 2.38 2.90 2.90c ðms 1 Þ 1390 1200 660 1420 1130 1420f 0 (Hz) 359 397 421 436 427 434St 0.23 0.26 0.22 0.23 0.18 0.19Fig. 16. From other experiments at EDF, visualization of the super cavitation regime for a <strong>s<strong>in</strong>gle</strong>-<strong>hole</strong> orifice.3.5. Super cavitation visualization <strong>and</strong> typical temporal signalIn the super cavitation regime, a vapor pocket is created <strong>in</strong> the jet region, as illustrated <strong>in</strong> Fig. 16.When the vapor pocket exp<strong>and</strong>s <strong>and</strong> reaches the downstream transducers, those transducers no longer deliver anyacoustical signal. This constitues an evidence for the existence of the vapor pocket.It appears that the length of the vapor pocket <strong>in</strong>creases quickly with flow velocity. The length of the vapor pocket<strong>in</strong>creases from about 7D at U 0 ¼ 3:8ms 1 to 18D at U 0 ¼ 4:4ms 1 <strong>and</strong> is larger than 38D at U 0 ¼ 4:7ms 1 for the<strong>s<strong>in</strong>gle</strong>-<strong>hole</strong> orifice. For the <strong>multi</strong>-<strong>hole</strong> orifice, the length of the vapor pocket <strong>in</strong>creases from around 7D at U 0 ¼ 4:2ms 1to larger than 38D at U 0 ¼ 4:5ms 1 .The typical time-fluctuat<strong>in</strong>g pressure signals obta<strong>in</strong>ed are very different from those <strong>in</strong> the developed cavitation regime(see Fig. 17). They are asymmetric around the mean pressure, exhibit<strong>in</strong>g very large positive spikes, up to 20 bar, l<strong>in</strong>kedto the collapse of bubbles.Focus<strong>in</strong>g on time signals (see an illustration <strong>in</strong> Fig. 18), it is seen that the phenomenon of bubble implosion ischaracterized first <strong>by</strong> a decrease <strong>in</strong> negative values of the fluctuat<strong>in</strong>g pressure with a characteristic duration of a tens ofmilliseconds, followed <strong>by</strong> an abrupt <strong>in</strong>crease of the pressure, a ‘spike’, with a characteristic duration of 1 ms. Bymodel<strong>in</strong>g this bubble volume evolution with a monopole source, which is a common <strong>and</strong> satisfactory simple model; see,for <strong>in</strong>stance, Brennen (1995), the first decrease is l<strong>in</strong>ked with a decrease of the bubble size from its <strong>in</strong>itial size to a valueclose to zero; the second part of the signal is l<strong>in</strong>ked with a pressure shock wave orig<strong>in</strong>at<strong>in</strong>g from the abrupt collision ofthe water particles. However, extremely high amplitudes are observed <strong>in</strong> comparison to Brennen (1995) (cf. Fig 3.19).This can be due either to the large size of our bubbles or to the effect of conf<strong>in</strong>ement.