Report of a cetacean survey in the Western Approaches of the ...
Report of a cetacean survey in the Western Approaches of the ...
Report of a cetacean survey in the Western Approaches of the ...
Create successful ePaper yourself
Turn your PDF publications into a flip-book with our unique Google optimized e-Paper software.
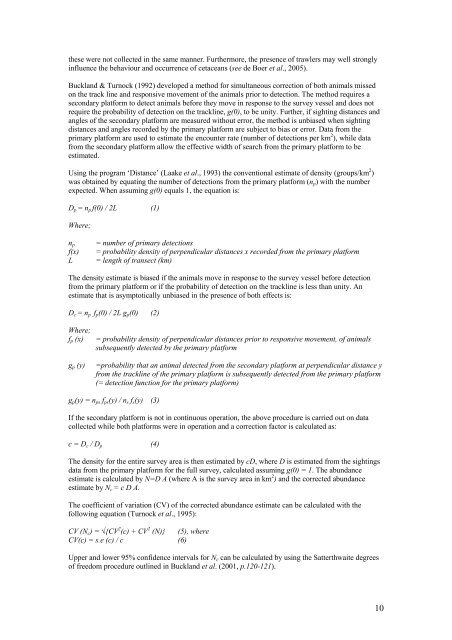
<strong>the</strong>se were not collected <strong>in</strong> <strong>the</strong> same manner. Fur<strong>the</strong>rmore, <strong>the</strong> presence <strong>of</strong> trawlers may well strongly<strong>in</strong>fluence <strong>the</strong> behaviour and occurrence <strong>of</strong> <strong>cetacean</strong>s (see de Boer et al., 2005).Buckland & Turnock (1992) developed a method for simultaneous correction <strong>of</strong> both animals missedon <strong>the</strong> track l<strong>in</strong>e and responsive movement <strong>of</strong> <strong>the</strong> animals prior to detection. The method requires asecondary platform to detect animals before <strong>the</strong>y move <strong>in</strong> response to <strong>the</strong> <strong>survey</strong> vessel and does notrequire <strong>the</strong> probability <strong>of</strong> detection on <strong>the</strong> trackl<strong>in</strong>e, g(0), to be unity. Fur<strong>the</strong>r, if sight<strong>in</strong>g distances andangles <strong>of</strong> <strong>the</strong> secondary platform are measured without error, <strong>the</strong> method is unbiased when sight<strong>in</strong>gdistances and angles recorded by <strong>the</strong> primary platform are subject to bias or error. Data from <strong>the</strong>primary platform are used to estimate <strong>the</strong> encounter rate (number <strong>of</strong> detections per km 2 ), while datafrom <strong>the</strong> secondary platform allow <strong>the</strong> effective width <strong>of</strong> search from <strong>the</strong> primary platform to beestimated.Us<strong>in</strong>g <strong>the</strong> program ‘Distance’ (Laake et al., 1993) <strong>the</strong> conventional estimate <strong>of</strong> density (groups/km 2 )was obta<strong>in</strong>ed by equat<strong>in</strong>g <strong>the</strong> number <strong>of</strong> detections from <strong>the</strong> primary platform (n p ) with <strong>the</strong> numberexpected. When assum<strong>in</strong>g g(0) equals 1, <strong>the</strong> equation is:D p = n p f(0) / 2L (1)Where;n pf(x)L= number <strong>of</strong> primary detections= probability density <strong>of</strong> perpendicular distances x recorded from <strong>the</strong> primary platform= length <strong>of</strong> transect (km)The density estimate is biased if <strong>the</strong> animals move <strong>in</strong> response to <strong>the</strong> <strong>survey</strong> vessel before detectionfrom <strong>the</strong> primary platform or if <strong>the</strong> probability <strong>of</strong> detection on <strong>the</strong> trackl<strong>in</strong>e is less than unity. Anestimate that is asymptotically unbiased <strong>in</strong> <strong>the</strong> presence <strong>of</strong> both effects is:D c = n p f p (0) / 2L g p (0) (2)Where;f p (x)g p (y)= probability density <strong>of</strong> perpendicular distances prior to responsive movement, <strong>of</strong> animalssubsequently detected by <strong>the</strong> primary platform=probability that an animal detected from <strong>the</strong> secondary platform at perpendicular distance yfrom <strong>the</strong> trackl<strong>in</strong>e <strong>of</strong> <strong>the</strong> primary platform is subsequently detected from <strong>the</strong> primary platform(= detection function for <strong>the</strong> primary platform)g p (y) = n ps f ps (y) / n s f s (y) (3)If <strong>the</strong> secondary platform is not <strong>in</strong> cont<strong>in</strong>uous operation, <strong>the</strong> above procedure is carried out on datacollected while both platforms were <strong>in</strong> operation and a correction factor is calculated as:c = D c / D p (4)The density for <strong>the</strong> entire <strong>survey</strong> area is <strong>the</strong>n estimated by cD, where D is estimated from <strong>the</strong> sight<strong>in</strong>gsdata from <strong>the</strong> primary platform for <strong>the</strong> full <strong>survey</strong>, calculated assum<strong>in</strong>g g(0) = 1. The abundanceestimate is calculated by N=D A (where A is <strong>the</strong> <strong>survey</strong> area <strong>in</strong> km 2 ) and <strong>the</strong> corrected abundanceestimate by N c = c D A.The coefficient <strong>of</strong> variation (CV) <strong>of</strong> <strong>the</strong> corrected abundance estimate can be calculated with <strong>the</strong>follow<strong>in</strong>g equation (Turnock et al., 1995):CV (N c ) = √{CV 2 (c) + CV 2 (N)} (5), whereCV(c) = s.e (c) / c (6)Upper and lower 95% confidence <strong>in</strong>tervals for N c can be calculated by us<strong>in</strong>g <strong>the</strong> Satterthwaite degrees<strong>of</strong> freedom procedure outl<strong>in</strong>ed <strong>in</strong> Buckland et al. (2001, p.120-121).10


