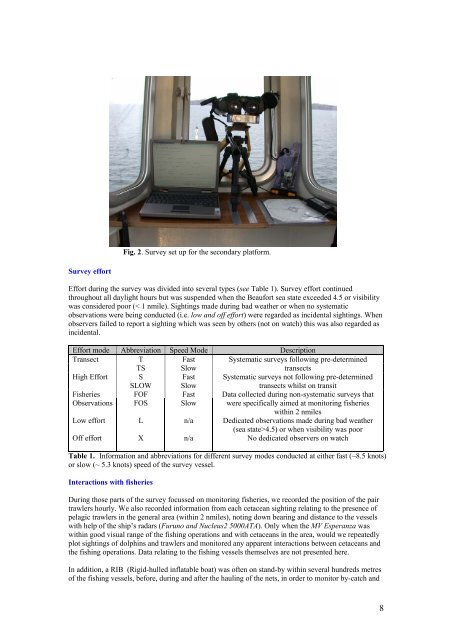
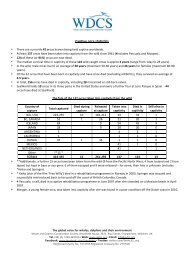
Fig. 2. Survey set up for <strong>the</strong> secondary platform.Survey effortEffort dur<strong>in</strong>g <strong>the</strong> <strong>survey</strong> was divided <strong>in</strong>to several types (see Table 1). Survey effort cont<strong>in</strong>uedthroughout all daylight hours but was suspended when <strong>the</strong> Beaufort sea state exceeded 4.5 or visibilitywas considered poor (< 1 nmile). Sight<strong>in</strong>gs made dur<strong>in</strong>g bad wea<strong>the</strong>r or when no systematicobservations were be<strong>in</strong>g conducted (i.e. low and <strong>of</strong>f effort) were regarded as <strong>in</strong>cidental sight<strong>in</strong>gs. Whenobservers failed to report a sight<strong>in</strong>g which was seen by o<strong>the</strong>rs (not on watch) this was also regarded as<strong>in</strong>cidental.Effort mode Abbreviation Speed Mode DescriptionTransectTFast Systematic <strong>survey</strong>s follow<strong>in</strong>g pre-determ<strong>in</strong>edTS SlowtransectsHigh Effort SFast Systematic <strong>survey</strong>s not follow<strong>in</strong>g pre-determ<strong>in</strong>edSLOW Slowtransects whilst on transitFisheries FOF Fast Data collected dur<strong>in</strong>g non-systematic <strong>survey</strong>s thatObservations FOS Slow were specifically aimed at monitor<strong>in</strong>g fisherieswith<strong>in</strong> 2 nmilesLow effort L n/a Dedicated observations made dur<strong>in</strong>g bad wea<strong>the</strong>r(sea state>4.5) or when visibility was poorOff effort X n/a No dedicated observers on watchTable 1. Information and abbreviations for different <strong>survey</strong> modes conducted at ei<strong>the</strong>r fast (~8.5 knots)or slow (~ 5.3 knots) speed <strong>of</strong> <strong>the</strong> <strong>survey</strong> vessel.Interactions with fisheriesDur<strong>in</strong>g those parts <strong>of</strong> <strong>the</strong> <strong>survey</strong> focussed on monitor<strong>in</strong>g fisheries, we recorded <strong>the</strong> position <strong>of</strong> <strong>the</strong> pairtrawlers hourly. We also recorded <strong>in</strong>formation from each <strong>cetacean</strong> sight<strong>in</strong>g relat<strong>in</strong>g to <strong>the</strong> presence <strong>of</strong>pelagic trawlers <strong>in</strong> <strong>the</strong> general area (with<strong>in</strong> 2 nmiles), not<strong>in</strong>g down bear<strong>in</strong>g and distance to <strong>the</strong> vesselswith help <strong>of</strong> <strong>the</strong> ship’s radars (Furuno and Nucleus2 5000ATA). Only when <strong>the</strong> MV Esperanza waswith<strong>in</strong> good visual range <strong>of</strong> <strong>the</strong> fish<strong>in</strong>g operations and with <strong>cetacean</strong>s <strong>in</strong> <strong>the</strong> area, would we repeatedlyplot sight<strong>in</strong>gs <strong>of</strong> dolph<strong>in</strong>s and trawlers and monitored any apparent <strong>in</strong>teractions between <strong>cetacean</strong>s and<strong>the</strong> fish<strong>in</strong>g operations. Data relat<strong>in</strong>g to <strong>the</strong> fish<strong>in</strong>g vessels <strong>the</strong>mselves are not presented here.In addition, a RIB (Rigid-hulled <strong>in</strong>flatable boat) was <strong>of</strong>ten on stand-by with<strong>in</strong> several hundreds metres<strong>of</strong> <strong>the</strong> fish<strong>in</strong>g vessels, before, dur<strong>in</strong>g and after <strong>the</strong> haul<strong>in</strong>g <strong>of</strong> <strong>the</strong> nets, <strong>in</strong> order to monitor by-catch and8
also to report <strong>the</strong> presence <strong>of</strong> dolph<strong>in</strong>s <strong>in</strong> vic<strong>in</strong>ity <strong>of</strong> <strong>the</strong> fish<strong>in</strong>g operations. No dedicated watches wereconducted from <strong>the</strong> RIB. Sight<strong>in</strong>gs made from <strong>the</strong> RIB or <strong>the</strong> ma<strong>in</strong> <strong>survey</strong> vessel dur<strong>in</strong>g suchoperations were regarded as <strong>in</strong>cidental.Dead dolph<strong>in</strong>sOn several occasions float<strong>in</strong>g dead dolph<strong>in</strong>s were sighted and, when possible, <strong>the</strong>se were retrieved by<strong>the</strong> Greenpeace crew for detailed external morphological exam<strong>in</strong>ations and to make <strong>the</strong>m available forlater full pathology. When a dead dolph<strong>in</strong> was sighted, <strong>the</strong> follow<strong>in</strong>g data were collected: time, date,position, sea state, swell height, cloud, visibility, w<strong>in</strong>d force, w<strong>in</strong>d direction, sea surface temperature,bear<strong>in</strong>g and distance to <strong>the</strong> dead dolph<strong>in</strong>. To help to retrieve <strong>the</strong> dolph<strong>in</strong>, a marker buoy wasimmediately placed <strong>in</strong> <strong>the</strong> vic<strong>in</strong>ity <strong>of</strong> <strong>the</strong> animal and a RIB was launched as swiftly as possible. Usually,<strong>the</strong> dead dolph<strong>in</strong>s were brought on board 1 .For each dead dolph<strong>in</strong> that was retrieved, <strong>the</strong> follow<strong>in</strong>g features were carefully photographed: wholeanimal, dorsal f<strong>in</strong> (left and right side), both flippers, head side view, top <strong>of</strong> <strong>the</strong> head/blowhole, eyes,close-up <strong>of</strong> <strong>the</strong> beak, fluke, flanks, genital regions and any obvious scarr<strong>in</strong>g. In addition, those deaddolph<strong>in</strong>s that were recovered and brought onboard were identified to species, <strong>the</strong>ir sex determ<strong>in</strong>ed andan assessment <strong>of</strong> <strong>the</strong> maturity status was made based on length and size. In addition to this, basic bodymeasurements, body temperature measurements and detailed morphological external exam<strong>in</strong>ations (seeWDCS, 2004) were carried out. When body temperatures were taken a digital <strong>the</strong>rmometer was<strong>in</strong>serted via <strong>the</strong> anus us<strong>in</strong>g a 50cm probe (MM2050/TM-electronics) and read<strong>in</strong>gs were taken atdifferent depths. The dead animals were supported by custom-built ‘hammocks’ and stored <strong>in</strong> aconta<strong>in</strong>er at a temperature <strong>of</strong> -5°C for three days after which <strong>the</strong> temperature was brought down andma<strong>in</strong>ta<strong>in</strong>ed at -10°C.Photo-identificationPhotographs <strong>of</strong> live small <strong>cetacean</strong>s were taken for natural mark<strong>in</strong>gs studies. Equipment used were (i) aCanon D20 with a Canon 70-200mm f2.8 lens or a Canon 24-70mm f2.8 lens; (ii) a M<strong>in</strong>olta Dynax D7with a Sigma 70-200mm f2.8 lens; and (iii) a Canon 300D with a Canon 35-350 f4-5.6 lens.Underwater video and photographyUnderwater footage <strong>of</strong> common dolph<strong>in</strong>s wake-rid<strong>in</strong>g <strong>the</strong> <strong>survey</strong> vessel were collected dur<strong>in</strong>g calmwea<strong>the</strong>r conditions. A custom-built underwater hous<strong>in</strong>g (made by G. Newman) was positioned on aflexible pole allow<strong>in</strong>g live images to be seen on a screen. A Toshiba TU-48p with a Tahoma 2mm lenswas used. Footage was recorded on a Sony DVCAM recorder. In addition, a Kodak ProSLR-N (14million pixels) with a Nikon 16mm fish-eye lens was also occasionally used to allow underwater stillsphotography (used <strong>in</strong> <strong>the</strong> underwater hous<strong>in</strong>g).Analytical methodsThe analyses are concentrated ma<strong>in</strong>ly on sight<strong>in</strong>gs made dur<strong>in</strong>g ‘Transect’ and ‘High Effort’ <strong>survey</strong>modes (part 1). Re-sight<strong>in</strong>gs and duplicate sight<strong>in</strong>gs were elim<strong>in</strong>ated from <strong>the</strong> ma<strong>in</strong> data set. Duplicatesight<strong>in</strong>gs (part 3) were identified on <strong>the</strong> basis <strong>of</strong> time and sub-sequent re-sight<strong>in</strong>gs, species ID, bestgroup size and head<strong>in</strong>g <strong>of</strong> <strong>the</strong> animal(s). Radial distances and angle data were converted toperpendicular distance (see Buckland et al., 1993).The distribution <strong>of</strong> sight<strong>in</strong>gs and <strong>the</strong> relative abundance, (N/L) measured as <strong>the</strong> number <strong>of</strong> sight<strong>in</strong>gs per100km travelled (where N is <strong>the</strong> number <strong>of</strong> sight<strong>in</strong>gs), are presented <strong>in</strong> part 1 <strong>of</strong> this report. In addition,average distance to shore, water depth, sea surface temperature (SST) and sea state associated withsight<strong>in</strong>gs data were calculated and presented for different species. For comparison, we also give anoverview <strong>of</strong> data obta<strong>in</strong>ed dur<strong>in</strong>g slow speed mode, although <strong>the</strong> sample sizes are much smaller thanfor fast speeds. Sight<strong>in</strong>gs made <strong>in</strong> vic<strong>in</strong>ity <strong>of</strong> fisheries should be regarded as a separate set <strong>of</strong> data as1 Animals were lifted onto deck us<strong>in</strong>g a belt around <strong>the</strong> tailstock and <strong>the</strong> ship’s crane, with <strong>the</strong>exception <strong>of</strong> one occasion when <strong>the</strong> animal was lifted with a belt around <strong>the</strong> body us<strong>in</strong>g <strong>the</strong> ship’scrane (due to high seas it was not possible to launch a RIB for <strong>the</strong> retrieval and <strong>the</strong> <strong>survey</strong> vessel wascarefully maneuvered alongside upon which <strong>the</strong> dolph<strong>in</strong> was retrieved).9