Report of a cetacean survey in the Western Approaches of the ...
Report of a cetacean survey in the Western Approaches of the ...
Report of a cetacean survey in the Western Approaches of the ...

You also want an ePaper? Increase the reach of your titles
YUMPU automatically turns print PDFs into web optimized ePapers that Google loves.
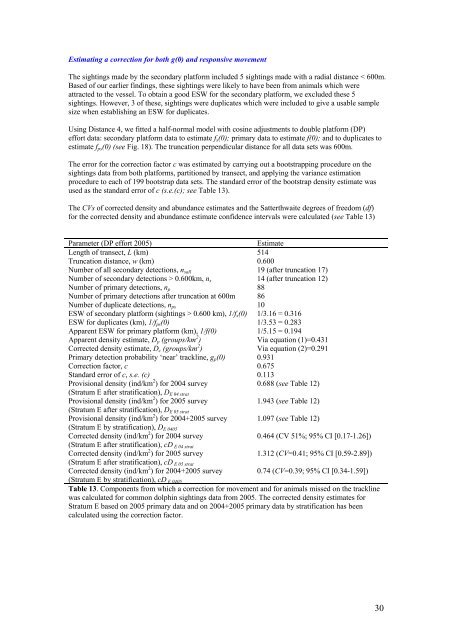
Estimat<strong>in</strong>g a correction for both g(0) and responsive movementThe sight<strong>in</strong>gs made by <strong>the</strong> secondary platform <strong>in</strong>cluded 5 sight<strong>in</strong>gs made with a radial distance < 600m.Based <strong>of</strong> our earlier f<strong>in</strong>d<strong>in</strong>gs, <strong>the</strong>se sight<strong>in</strong>gs were likely to have been from animals which wereattracted to <strong>the</strong> vessel. To obta<strong>in</strong> a good ESW for <strong>the</strong> secondary platform, we excluded <strong>the</strong>se 5sight<strong>in</strong>gs. However, 3 <strong>of</strong> <strong>the</strong>se, sight<strong>in</strong>gs were duplicates which were <strong>in</strong>cluded to give a usable samplesize when establish<strong>in</strong>g an ESW for duplicates.Us<strong>in</strong>g Distance 4, we fitted a half-normal model with cos<strong>in</strong>e adjustments to double platform (DP)effort data: secondary platform data to estimate f s (0); primary data to estimate f(0); and to duplicates toestimate f ps (0) (see Fig. 18). The truncation perpendicular distance for all data sets was 600m.The error for <strong>the</strong> correction factor c was estimated by carry<strong>in</strong>g out a bootstrapp<strong>in</strong>g procedure on <strong>the</strong>sight<strong>in</strong>gs data from both platforms, partitioned by transect, and apply<strong>in</strong>g <strong>the</strong> variance estimationprocedure to each <strong>of</strong> 199 bootstrap data sets. The standard error <strong>of</strong> <strong>the</strong> bootstrap density estimate wasused as <strong>the</strong> standard error <strong>of</strong> c (s.e.(c); see Table 13).The CVs <strong>of</strong> corrected density and abundance estimates and <strong>the</strong> Satterthwaite degrees <strong>of</strong> freedom (df)for <strong>the</strong> corrected density and abundance estimate confidence <strong>in</strong>tervals were calculated (see Table 13)Parameter (DP effort 2005)EstimateLength <strong>of</strong> transect, L (km) 514Truncation distance, w (km) 0.600Number <strong>of</strong> all secondary detections, n sall 19 (after truncation 17)Number <strong>of</strong> secondary detections > 0.600km, n s 14 (after truncation 12)Number <strong>of</strong> primary detections, n p 88Number <strong>of</strong> primary detections after truncation at 600m 86Number <strong>of</strong> duplicate detections, n ps 10ESW <strong>of</strong> secondary platform (sight<strong>in</strong>gs > 0.600 km), 1/f s (0) 1/3.16 = 0.316ESW for duplicates (km), 1/f ps (0) 1/3.53 = 0.283Apparent ESW for primary platform (km), 1/f(0) 1/5.15 = 0.194Apparent density estimate, D p (groups/km 2 ) Via equation (1)=0.431Corrected density estimate, D c (groups/km 2 ) Via equation (2)=0.291Primary detection probability ‘near’ trackl<strong>in</strong>e, g p (0) 0.931Correction factor, c 0.675Standard error <strong>of</strong> c, s.e. (c) 0.113Provisional density (<strong>in</strong>d/km 2 ) for 2004 <strong>survey</strong>0.688 (see Table 12)(Stratum E after stratification), D E 04 stratProvisional density (<strong>in</strong>d/km 2 ) for 2005 <strong>survey</strong>1.943 (see Table 12)(Stratum E after stratification), D E 05 stratProvisional density (<strong>in</strong>d/km 2 ) for 2004+2005 <strong>survey</strong> 1.097 (see Table 12)(Stratum E by stratification), D E 0405Corrected density (<strong>in</strong>d/km 2 ) for 2004 <strong>survey</strong>0.464 (CV 51%; 95% CI [0.17-1.26])(Stratum E after stratification), cD E 04 stratCorrected density (<strong>in</strong>d/km 2 ) for 2005 <strong>survey</strong>1.312 (CV=0.41; 95% CI [0.59-2.89])(Stratum E after stratification), cD E 05 stratCorrected density (<strong>in</strong>d/km 2 ) for 2004+2005 <strong>survey</strong> 0.74 (CV=0.39; 95% CI [0.34-1.59])(Stratum E by stratification), cD E 0405Table 13. Components from which a correction for movement and for animals missed on <strong>the</strong> trackl<strong>in</strong>ewas calculated for common dolph<strong>in</strong> sight<strong>in</strong>gs data from 2005. The corrected density estimates forStratum E based on 2005 primary data and on 2004+2005 primary data by stratification has beencalculated us<strong>in</strong>g <strong>the</strong> correction factor.30