Report of a cetacean survey in the Western Approaches of the ...
Report of a cetacean survey in the Western Approaches of the ...
Report of a cetacean survey in the Western Approaches of the ...

You also want an ePaper? Increase the reach of your titles
YUMPU automatically turns print PDFs into web optimized ePapers that Google loves.
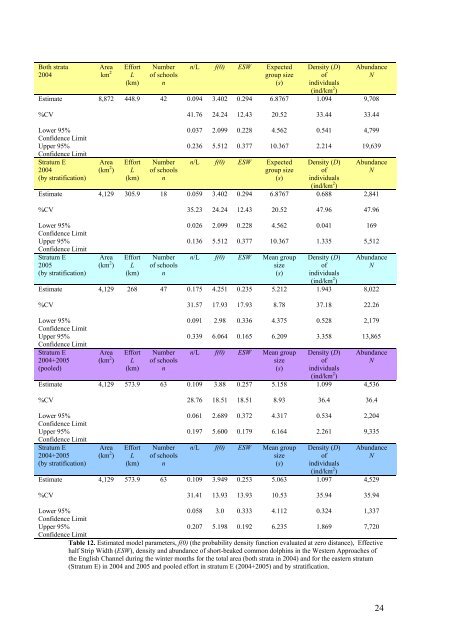
Both strata2004Areakm 2EffortL(km)Number<strong>of</strong> schoolsnn/L f(0) ESW Expectedgroup size(s)Density (D)<strong>of</strong><strong>in</strong>dividuals(<strong>in</strong>d/km 2 )AbundanceNEstimate 8,872 448.9 42 0.094 3.402 0.294 6.8767 1.094 9,708%CV 41.76 24.24 12.43 20.52 33.44 33.44Lower 95%Confidence LimitUpper 95%Confidence LimitStratum E2004(by stratification)Area(km 2 )EffortL(km)Number<strong>of</strong> schoolsn0.037 2.099 0.228 4.562 0.541 4,7990.236 5.512 0.377 10.367 2.214 19,639n/L f(0) ESW Expectedgroup size(s)Density (D)<strong>of</strong><strong>in</strong>dividuals(<strong>in</strong>d/km 2 )AbundanceNEstimate 4,129 305.9 18 0.059 3.402 0.294 6.8767 0.688 2,841%CV 35.23 24.24 12.43 20.52 47.96 47.96Lower 95%Confidence LimitUpper 95%Confidence LimitStratum E2005(by stratification)Area(km 2 )EffortL(km)Number<strong>of</strong> schoolsn0.026 2.099 0.228 4.562 0.041 1690.136 5.512 0.377 10.367 1.335 5,512n/L f(0) ESW Mean groupsize(s)Density (D)<strong>of</strong><strong>in</strong>dividuals(<strong>in</strong>d/km 2 )AbundanceNEstimate 4,129 268 47 0.175 4.251 0.235 5.212 1.943 8,022%CV 31.57 17.93 17.93 8.78 37.18 22.26Lower 95%Confidence LimitUpper 95%Confidence LimitStratum E2004+2005(pooled)Area(km 2 )EffortL(km)Number<strong>of</strong> schoolsn0.091 2.98 0.336 4.375 0.528 2,1790.339 6.064 0.165 6.209 3.358 13,865n/L f(0) ESW Mean groupsize(s)Density (D)<strong>of</strong><strong>in</strong>dividuals(<strong>in</strong>d/km 2 )AbundanceNEstimate 4,129 573.9 63 0.109 3.88 0.257 5.158 1.099 4,536%CV 28.76 18.51 18.51 8.93 36.4 36.4Lower 95%Confidence LimitUpper 95%Confidence LimitStratum E2004+2005(by stratification)Area(km 2 )EffortL(km)Number<strong>of</strong> schoolsn0.061 2.689 0.372 4.317 0.534 2,2040.197 5.600 0.179 6.164 2.261 9,335n/L f(0) ESW Mean groupsize(s)Density (D)<strong>of</strong><strong>in</strong>dividuals(<strong>in</strong>d/km 2 )AbundanceNEstimate 4,129 573.9 63 0.109 3.949 0.253 5.063 1.097 4,529%CV 31.41 13.93 13.93 10.53 35.94 35.94Lower 95%0.058 3.0 0.333 4.112 0.324 1,337Confidence LimitUpper 95%0.207 5.198 0.192 6.235 1.869 7,720Confidence LimitTable 12. Estimated model parameters, f(0) (<strong>the</strong> probability density function evaluated at zero distance), Effectivehalf Strip Width (ESW), density and abundance <strong>of</strong> short-beaked common dolph<strong>in</strong>s <strong>in</strong> <strong>the</strong> <strong>Western</strong> <strong>Approaches</strong> <strong>of</strong><strong>the</strong> English Channel dur<strong>in</strong>g <strong>the</strong> w<strong>in</strong>ter months for <strong>the</strong> total area (both strata <strong>in</strong> 2004) and for <strong>the</strong> eastern stratum(Stratum E) <strong>in</strong> 2004 and 2005 and pooled effort <strong>in</strong> stratum E (2004+2005) and by stratification.24