Report of a cetacean survey in the Western Approaches of the ...
Report of a cetacean survey in the Western Approaches of the ...
Report of a cetacean survey in the Western Approaches of the ...

Create successful ePaper yourself
Turn your PDF publications into a flip-book with our unique Google optimized e-Paper software.
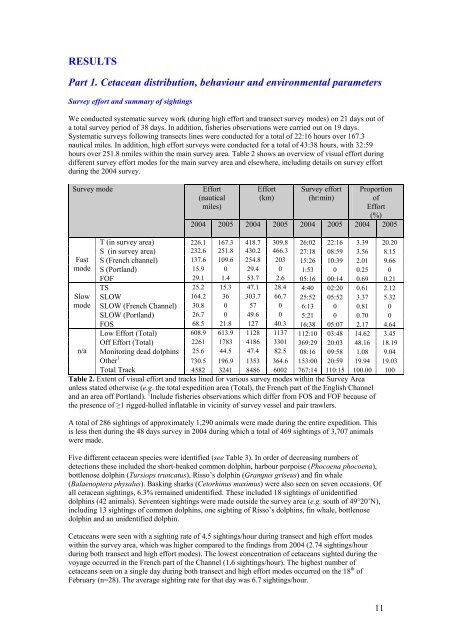
RESULTSPart 1. Cetacean distribution, behaviour and environmental parametersSurvey effort and summary <strong>of</strong> sight<strong>in</strong>gsWe conducted systematic <strong>survey</strong> work (dur<strong>in</strong>g high effort and transect <strong>survey</strong> modes) on 21 days out <strong>of</strong>a total <strong>survey</strong> period <strong>of</strong> 38 days. In addition, fisheries observations were carried out on 19 days.Systematic <strong>survey</strong>s follow<strong>in</strong>g transects l<strong>in</strong>es were conducted for a total <strong>of</strong> 22:16 hours over 167.3nautical miles. In addition, high effort <strong>survey</strong>s were conducted for a total <strong>of</strong> 43:38 hours, with 32:59hours over 251.8 nmiles with<strong>in</strong> <strong>the</strong> ma<strong>in</strong> <strong>survey</strong> area. Table 2 shows an overview <strong>of</strong> visual effort dur<strong>in</strong>gdifferent <strong>survey</strong> effort modes for <strong>the</strong> ma<strong>in</strong> <strong>survey</strong> area and elsewhere, <strong>in</strong>clud<strong>in</strong>g details on <strong>survey</strong> effortdur<strong>in</strong>g <strong>the</strong> 2004 <strong>survey</strong>.Survey modeEffort(nauticalmiles)Effort(km)Survey effort(hr:m<strong>in</strong>)Proportion<strong>of</strong>Effort(%)2004 2005 2004 2005 2004 2005 2004 2005FastmodeSlowmoden/aT (<strong>in</strong> <strong>survey</strong> area) 226.1 167.3 418.7 309.8 26:02 22:16 3.39 20.20S (<strong>in</strong> <strong>survey</strong> area) 232.6 251.8 430.2 466.3 27:18 08:59 3.56 8.15S (French channel) 137.6 109.6 254.8 203 15:26 10:39 2.01 9.66S (Portland) 15.9 0 29.4 0 1:53 0 0.25 0FOF 29.1 1.4 53.7 2.6 05:16 00:14 0.69 0.21TS 25.2 15.3 47.1 28.4 4:40 02:20 0.61 2.12SLOW 164.2 36 303.7 66.7 25:52 05:52 3.37 5.32SLOW (French Channel) 30.8 0 57 0 6:13 0 0.81 0SLOW (Portland) 26.7 0 49.6 0 5:21 0 0.70 0FOS 68.5 21.8 127 40.3 16:38 05:07 2.17 4.64Low Effort (Total) 608.9 613.9 1128 1137 112:10 03:48 14.62 3.45Off Effort (Total) 2261 1783 4186 3301 369:29 20:03 48.16 18.19Monitor<strong>in</strong>g dead dolph<strong>in</strong>s 25.6 44.5 47.4 82.5 08:16 09:58 1.08 9.04O<strong>the</strong>r 1 730.5 196.9 1353 364.6 153:00 20:59 19.94 19.03Total Track 4582 3241 8486 6002 767:14 110:15 100.00 100Table 2. Extent <strong>of</strong> visual effort and tracks l<strong>in</strong>ed for various <strong>survey</strong> modes with<strong>in</strong> <strong>the</strong> Survey Areaunless stated o<strong>the</strong>rwise (e.g. <strong>the</strong> total expedition area (Total), <strong>the</strong> French part <strong>of</strong> <strong>the</strong> English Channeland an area <strong>of</strong>f Portland). 1 Include fisheries observations which differ from FOS and FOF because <strong>of</strong><strong>the</strong> presence <strong>of</strong> ≥1 rigged-hulled <strong>in</strong>flatable <strong>in</strong> vic<strong>in</strong>ity <strong>of</strong> <strong>survey</strong> vessel and pair trawlers.A total <strong>of</strong> 286 sight<strong>in</strong>gs <strong>of</strong> approximately 1,290 animals were made dur<strong>in</strong>g <strong>the</strong> entire expedition. Thisis less <strong>the</strong>n dur<strong>in</strong>g <strong>the</strong> 48 days <strong>survey</strong> <strong>in</strong> 2004 dur<strong>in</strong>g which a total <strong>of</strong> 469 sight<strong>in</strong>gs <strong>of</strong> 3,707 animalswere made.Five different <strong>cetacean</strong> species were identified (see Table 3). In order <strong>of</strong> decreas<strong>in</strong>g numbers <strong>of</strong>detections <strong>the</strong>se <strong>in</strong>cluded <strong>the</strong> short-beaked common dolph<strong>in</strong>, harbour porpoise (Phocoena phocoena),bottlenose dolph<strong>in</strong> (Tursiops truncatus), Risso’s dolph<strong>in</strong> (Grampus griseus) and f<strong>in</strong> whale(Balaenoptera physalus). Bask<strong>in</strong>g sharks (Cetorh<strong>in</strong>us maximus) were also seen on seven occasions. Ofall <strong>cetacean</strong> sight<strong>in</strong>gs, 6.3% rema<strong>in</strong>ed unidentified. These <strong>in</strong>cluded 18 sight<strong>in</strong>gs <strong>of</strong> unidentifieddolph<strong>in</strong>s (42 animals). Seventeen sight<strong>in</strong>gs were made outside <strong>the</strong> <strong>survey</strong> area (e.g. south <strong>of</strong> 49°20’N),<strong>in</strong>clud<strong>in</strong>g 13 sight<strong>in</strong>gs <strong>of</strong> common dolph<strong>in</strong>s, one sight<strong>in</strong>g <strong>of</strong> Risso’s dolph<strong>in</strong>s, f<strong>in</strong> whale, bottlenosedolph<strong>in</strong> and an unidentified dolph<strong>in</strong>.Cetaceans were seen with a sight<strong>in</strong>g rate <strong>of</strong> 4.5 sight<strong>in</strong>gs/hour dur<strong>in</strong>g transect and high effort modeswith<strong>in</strong> <strong>the</strong> <strong>survey</strong> area, which was higher compared to <strong>the</strong> f<strong>in</strong>d<strong>in</strong>gs from 2004 (2.74 sight<strong>in</strong>gs/hourdur<strong>in</strong>g both transect and high effort modes). The lowest concentration <strong>of</strong> <strong>cetacean</strong>s sighted dur<strong>in</strong>g <strong>the</strong>voyage occurred <strong>in</strong> <strong>the</strong> French part <strong>of</strong> <strong>the</strong> Channel (1.6 sight<strong>in</strong>gs/hour). The highest number <strong>of</strong><strong>cetacean</strong>s seen on a s<strong>in</strong>gle day dur<strong>in</strong>g both transect and high effort modes occurred on <strong>the</strong> 18 th <strong>of</strong>February (n=28). The average sight<strong>in</strong>g rate for that day was 6.7 sight<strong>in</strong>gs/hour.11