Report of a cetacean survey in the Western Approaches of the ...
Report of a cetacean survey in the Western Approaches of the ...
Report of a cetacean survey in the Western Approaches of the ...

You also want an ePaper? Increase the reach of your titles
YUMPU automatically turns print PDFs into web optimized ePapers that Google loves.
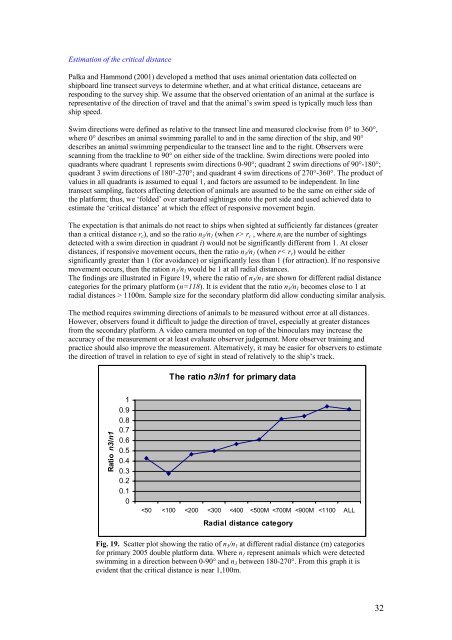
Estimation <strong>of</strong> <strong>the</strong> critical distancePalka and Hammond (2001) developed a method that uses animal orientation data collected onshipboard l<strong>in</strong>e transect <strong>survey</strong>s to determ<strong>in</strong>e whe<strong>the</strong>r, and at what critical distance, <strong>cetacean</strong>s arerespond<strong>in</strong>g to <strong>the</strong> <strong>survey</strong> ship. We assume that <strong>the</strong> observed orientation <strong>of</strong> an animal at <strong>the</strong> surface isrepresentative <strong>of</strong> <strong>the</strong> direction <strong>of</strong> travel and that <strong>the</strong> animal’s swim speed is typically much less thanship speed.Swim directions were def<strong>in</strong>ed as relative to <strong>the</strong> transect l<strong>in</strong>e and measured clockwise from 0° to 360°,where 0° describes an animal swimm<strong>in</strong>g parallel to and <strong>in</strong> <strong>the</strong> same direction <strong>of</strong> <strong>the</strong> ship, and 90°describes an animal swimm<strong>in</strong>g perpendicular to <strong>the</strong> transect l<strong>in</strong>e and to <strong>the</strong> right. Observers werescann<strong>in</strong>g from <strong>the</strong> trackl<strong>in</strong>e to 90° on ei<strong>the</strong>r side <strong>of</strong> <strong>the</strong> trackl<strong>in</strong>e. Swim directions were pooled <strong>in</strong>toquadrants where quadrant 1 represents swim directions 0-90°; quadrant 2 swim directions <strong>of</strong> 90°-180°;quadrant 3 swim directions <strong>of</strong> 180°-270°; and quadrant 4 swim directions <strong>of</strong> 270°-360°. The product <strong>of</strong>values <strong>in</strong> all quadrants is assumed to equal 1, and factors are assumed to be <strong>in</strong>dependent. In l<strong>in</strong>etransect sampl<strong>in</strong>g, factors affect<strong>in</strong>g detection <strong>of</strong> animals are assumed to be <strong>the</strong> same on ei<strong>the</strong>r side <strong>of</strong><strong>the</strong> platform; thus, we ‘folded’ over starboard sight<strong>in</strong>gs onto <strong>the</strong> port side and used achieved data toestimate <strong>the</strong> ‘critical distance’ at which <strong>the</strong> effect <strong>of</strong> responsive movement beg<strong>in</strong>.The expectation is that animals do not react to ships when sighted at sufficiently far distances (greaterthan a critical distance r c ), and so <strong>the</strong> ratio n 3 /n 1 (when r> r c , where n i are <strong>the</strong> number <strong>of</strong> sight<strong>in</strong>gsdetected with a swim direction <strong>in</strong> quadrant i) would not be significantly different from 1. At closerdistances, if responsive movement occurs, <strong>the</strong>n <strong>the</strong> ratio n 3 /n 1 (when r< r c ) would be ei<strong>the</strong>rsignificantly greater than 1 (for avoidance) or significantly less than 1 (for attraction). If no responsivemovement occurs, <strong>the</strong>n <strong>the</strong> ration n 3 /n 1 would be 1 at all radial distances.The f<strong>in</strong>d<strong>in</strong>gs are illustrated <strong>in</strong> Figure 19, where <strong>the</strong> ratio <strong>of</strong> n 3 /n 1 are shown for different radial distancecategories for <strong>the</strong> primary platform (n=118). It is evident that <strong>the</strong> ratio n 3 /n 1 becomes close to 1 atradial distances > 1100m. Sample size for <strong>the</strong> secondary platform did allow conduct<strong>in</strong>g similar analysis.The method requires swimm<strong>in</strong>g directions <strong>of</strong> animals to be measured without error at all distances.However, observers found it difficult to judge <strong>the</strong> direction <strong>of</strong> travel, especially at greater distancesfrom <strong>the</strong> secondary platform. A video camera mounted on top <strong>of</strong> <strong>the</strong> b<strong>in</strong>oculars may <strong>in</strong>crease <strong>the</strong>accuracy <strong>of</strong> <strong>the</strong> measurement or at least evaluate observer judgement. More observer tra<strong>in</strong><strong>in</strong>g andpractice should also improve <strong>the</strong> measurement. Alternatively, it may be easier for observers to estimate<strong>the</strong> direction <strong>of</strong> travel <strong>in</strong> relation to eye <strong>of</strong> sight <strong>in</strong> stead <strong>of</strong> relatively to <strong>the</strong> ship’s track.The ratio n3/n1 for primary dataRatio n3/n110.90.80.70.60.50.40.30.20.10