Report of a cetacean survey in the Western Approaches of the ...
Report of a cetacean survey in the Western Approaches of the ...
Report of a cetacean survey in the Western Approaches of the ...
Create successful ePaper yourself
Turn your PDF publications into a flip-book with our unique Google optimized e-Paper software.
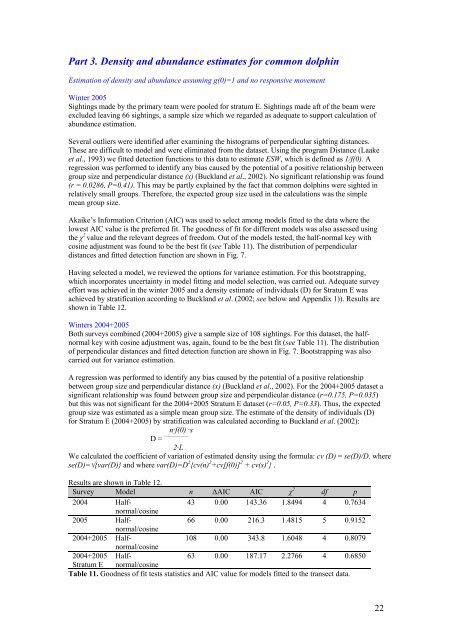
Part 3. Density and abundance estimates for common dolph<strong>in</strong>Estimation <strong>of</strong> density and abundance assum<strong>in</strong>g g(0)=1 and no responsive movementW<strong>in</strong>ter 2005Sight<strong>in</strong>gs made by <strong>the</strong> primary team were pooled for stratum E. Sight<strong>in</strong>gs made aft <strong>of</strong> <strong>the</strong> beam wereexcluded leav<strong>in</strong>g 66 sight<strong>in</strong>gs, a sample size which we regarded as adequate to support calculation <strong>of</strong>abundance estimation.Several outliers were identified after exam<strong>in</strong><strong>in</strong>g <strong>the</strong> histograms <strong>of</strong> perpendicular sight<strong>in</strong>g distances.These are difficult to model and were elim<strong>in</strong>ated from <strong>the</strong> dataset. Us<strong>in</strong>g <strong>the</strong> program Distance (Laakeet al., 1993) we fitted detection functions to this data to estimate ESW, which is def<strong>in</strong>ed as 1/f(0). Aregression was performed to identify any bias caused by <strong>the</strong> potential <strong>of</strong> a positive relationship betweengroup size and perpendicular distance (x) (Buckland et al., 2002). No significant relationship was found(r = 0.0286, P=0.41). This may be partly expla<strong>in</strong>ed by <strong>the</strong> fact that common dolph<strong>in</strong>s were sighted <strong>in</strong>relatively small groups. Therefore, <strong>the</strong> expected group size used <strong>in</strong> <strong>the</strong> calculations was <strong>the</strong> simplemean group size.Akaike’s Information Criterion (AIC) was used to select among models fitted to <strong>the</strong> data where <strong>the</strong>lowest AIC value is <strong>the</strong> preferred fit. The goodness <strong>of</strong> fit for different models was also assessed us<strong>in</strong>g<strong>the</strong> χ 2 value and <strong>the</strong> relevant degrees <strong>of</strong> freedom. Out <strong>of</strong> <strong>the</strong> models tested, <strong>the</strong> half-normal key withcos<strong>in</strong>e adjustment was found to be <strong>the</strong> best fit (see Table 11). The distribution <strong>of</strong> perpendiculardistances and fitted detection function are shown <strong>in</strong> Fig. 7.Hav<strong>in</strong>g selected a model, we reviewed <strong>the</strong> options for variance estimation. For this bootstrapp<strong>in</strong>g,which <strong>in</strong>corporates uncerta<strong>in</strong>ty <strong>in</strong> model fitt<strong>in</strong>g and model selection, was carried out. Adequate <strong>survey</strong>effort was achieved <strong>in</strong> <strong>the</strong> w<strong>in</strong>ter 2005 and a density estimate <strong>of</strong> <strong>in</strong>dividuals (D) for Stratum E wasachieved by stratification accord<strong>in</strong>g to Buckland et al. (2002; see below and Appendix 1)). Results areshown <strong>in</strong> Table 12.W<strong>in</strong>ters 2004+2005Both <strong>survey</strong>s comb<strong>in</strong>ed (2004+2005) give a sample size <strong>of</strong> 108 sight<strong>in</strong>gs. For this dataset, <strong>the</strong> halfnormalkey with cos<strong>in</strong>e adjustment was, aga<strong>in</strong>, found to be <strong>the</strong> best fit (see Table 11). The distribution<strong>of</strong> perpendicular distances and fitted detection function are shown <strong>in</strong> Fig. 7. Bootstrapp<strong>in</strong>g was alsocarried out for variance estimation.A regression was performed to identify any bias caused by <strong>the</strong> potential <strong>of</strong> a positive relationshipbetween group size and perpendicular distance (x) (Buckland et al., 2002). For <strong>the</strong> 2004+2005 dataset asignificant relationship was found between group size and perpendicular distance (r=0.175, P=0.035)but this was not significant for <strong>the</strong> 2004+2005 Stratum E dataset (r=0.05, P=0.33). Thus, <strong>the</strong> expectedgroup size was estimated as a simple mean group size. The estimate <strong>of</strong> <strong>the</strong> density <strong>of</strong> <strong>in</strong>dividuals (D)for Stratum E (2004+2005) by stratification was calculated accord<strong>in</strong>g to Buckland et al. (2002):n·f(0) ·sD = —————2·LWe calculated <strong>the</strong> coefficient <strong>of</strong> variation <strong>of</strong> estimated density us<strong>in</strong>g <strong>the</strong> formula: cv (D) = se(D)/D, wherese(D)=q{var(D)} and where var(D)=D 2 {cv(n) 2 +cv[f(0)] 2 + cv(s) 2 } .Results are shown <strong>in</strong> Table 12.Survey Model n ∆AIC AIC χ 2 df p2004 Halfnormal/cos<strong>in</strong>e43 0.00 143.36 1.8494 4 0.76342005 Halfnormal/cos<strong>in</strong>e66 0.00 216.3 1.4815 5 0.91522004+2005 Halfnormal/cos<strong>in</strong>e108 0.00 343.8 1.6048 4 0.80792004+2005 Halfnormal/cos<strong>in</strong>e63 0.00 187.17 2.2766 4 0.6850Stratum ETable 11. Goodness <strong>of</strong> fit tests statistics and AIC value for models fitted to <strong>the</strong> transect data.22


