Dissertation - FTP Directory Listing - University of Surrey
Dissertation - FTP Directory Listing - University of Surrey
Dissertation - FTP Directory Listing - University of Surrey

Create successful ePaper yourself
Turn your PDF publications into a flip-book with our unique Google optimized e-Paper software.
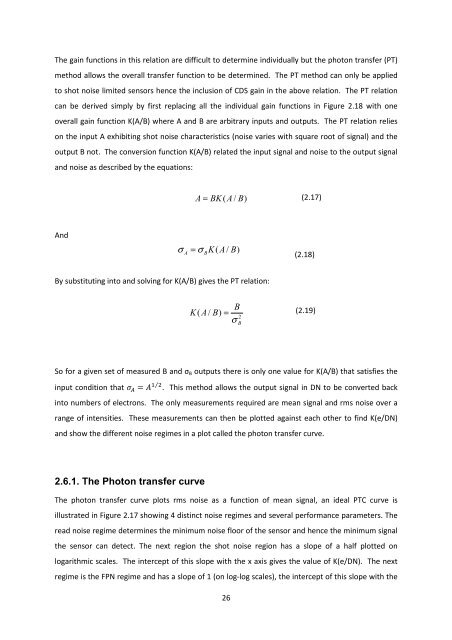
The gain functions in this relation are difficult to determine individually but the photon transfer (PT)method allows the overall transfer function to be determined. The PT method can only be appliedto shot noise limited sensors hence the inclusion <strong>of</strong> CDS gain in the above relation. The PT relationcan be derived simply by first replacing all the individual gain functions in Figure 2.18 with oneoverall gain function K(A/B) where A and B are arbitrary inputs and outputs. The PT relation relieson the input A exhibiting shot noise characteristics (noise varies with square root <strong>of</strong> signal) and theoutput B not. The conversion function K(A/B) related the input signal and noise to the output signaland noise as described by the equations:A = BK ( A / B)(2.17)AndσA= σ BK( A / B)(2.18)By substituting into and solving for K(A/B) gives the PT relation:BK(A / B)=σ2B(2.19)So for a given set <strong>of</strong> measured B and σ B outputs there is only one value for K(A/B) that satisfies theinput condition that = ⁄ . This method allows the output signal in DN to be converted backinto numbers <strong>of</strong> electrons. The only measurements required are mean signal and rms noise over arange <strong>of</strong> intensities. These measurements can then be plotted against each other to find K(e/DN)and show the different noise regimes in a plot called the photon transfer curve.2.6.1. The Photon transfer curveThe photon transfer curve plots rms noise as a function <strong>of</strong> mean signal, an ideal PTC curve isillustrated in Figure 2.17 showing 4 distinct noise regimes and several performance parameters. Theread noise regime determines the minimum noise floor <strong>of</strong> the sensor and hence the minimum signalthe sensor can detect. The next region the shot noise region has a slope <strong>of</strong> a half plotted onlogarithmic scales. The intercept <strong>of</strong> this slope with the x axis gives the value <strong>of</strong> K(e/DN). The nextregime is the FPN regime and has a slope <strong>of</strong> 1 (on log-log scales), the intercept <strong>of</strong> this slope with the26