Dissertation - FTP Directory Listing - University of Surrey
Dissertation - FTP Directory Listing - University of Surrey
Dissertation - FTP Directory Listing - University of Surrey

Create successful ePaper yourself
Turn your PDF publications into a flip-book with our unique Google optimized e-Paper software.
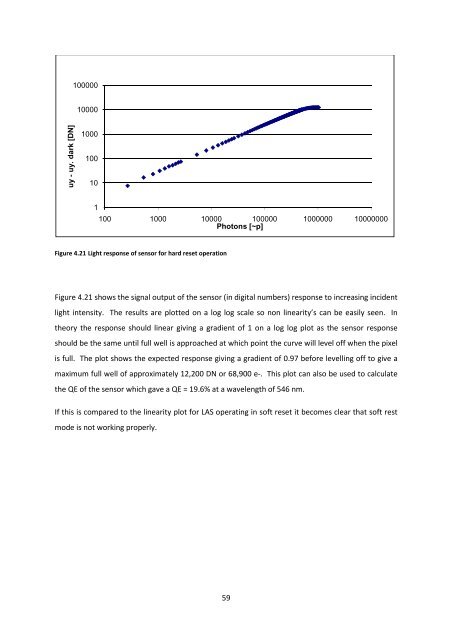
10000010000uy - uy. dark [DN]1000100101100 1000 10000 100000 1000000 10000000Photons [~p]Figure 4.21 Light response <strong>of</strong> sensor for hard reset operationFigure 4.21 shows the signal output <strong>of</strong> the sensor (in digital numbers) response to increasing incidentlight intensity. The results are plotted on a log log scale so non linearity’s can be easily seen. Intheory the response should linear giving a gradient <strong>of</strong> 1 on a log log plot as the sensor responseshould be the same until full well is approached at which point the curve will level <strong>of</strong>f when the pixelis full. The plot shows the expected response giving a gradient <strong>of</strong> 0.97 before levelling <strong>of</strong>f to give amaximum full well <strong>of</strong> approximately 12,200 DN or 68,900 e-. This plot can also be used to calculatethe QE <strong>of</strong> the sensor which gave a QE = 19.6% at a wavelength <strong>of</strong> 546 nm.If this is compared to the linearity plot for LAS operating in s<strong>of</strong>t reset it becomes clear that s<strong>of</strong>t restmode is not working properly.59