Fatigue Crack Growth in 7050T7451 Aluminium Alloy Thick Section ...
Fatigue Crack Growth in 7050T7451 Aluminium Alloy Thick Section ...
Fatigue Crack Growth in 7050T7451 Aluminium Alloy Thick Section ...

Create successful ePaper yourself
Turn your PDF publications into a flip-book with our unique Google optimized e-Paper software.
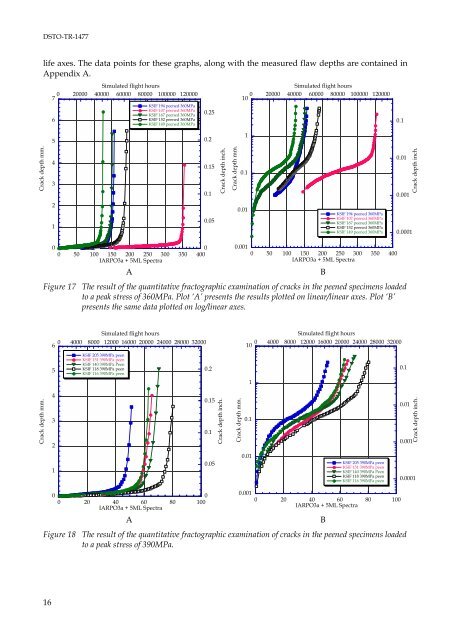
DSTO-TR-1477life axes. The data po<strong>in</strong>ts for these graphs, along with the measured flaw depths are conta<strong>in</strong>ed <strong>in</strong>Appendix A.Simulated flight hours0 20000 40000 60000 80000 100000 12000076KSIF 194 peened 360MPaKSIF 107 peened 360MPaKSIF 167 peened 360MPaKSIF 152 peened 360MPaKSIF 149 peened 360MPa0.25Simulated flight hours0 20000 40000 60000 80000 100000 120000100.150.21<strong>Crack</strong> depth mm.430.150.1<strong>Crack</strong> depth <strong>in</strong>ch.<strong>Crack</strong> depth mm.0.10.010.001<strong>Crack</strong> depth <strong>in</strong>ch.210.050.01KSIF 194 peened 360MPaKSIF 107 peened 360MPaKSIF 167 peened 360MPaKSIF 152 peened 360MPaKSIF 149 peened 360MPa0.0001000 50 100 150 200 250 300 350 400IARPO3a + 5ML Spectra0.0010 50 100 150 200 250 300 350 400IARPO3a + 5ML SpectraABFigure 17 The result of the quantitative fractographic exam<strong>in</strong>ation of cracks <strong>in</strong> the peened specimens loadedto a peak stress of 360MPa. Plot ‘A’ presents the results plotted on l<strong>in</strong>ear/l<strong>in</strong>ear axes. Plot ‘B’presents the same data plotted on log/l<strong>in</strong>ear axes.0 4000 8000 12000 16000 20000 24000 28000 3200065Simulated flight hoursKSIF 205 390MPa peenKSIF 151 390MPa peenKSIF 140 390MPa PeenKSIF 118 390MPa peenKSIF 116 390MPa peen0.2Simulated flight hours0104000 8000 12000 16000 20000 24000 28000 320000.11<strong>Crack</strong> depth mm.4320.150.1<strong>Crack</strong> depth <strong>in</strong>ch.<strong>Crack</strong> depth mm.0.10.010.001<strong>Crack</strong> depth <strong>in</strong>ch.10.050.01KSIF 205 390MPa peenKSIF 151 390MPa peenKSIF 140 390MPa PeenKSIF 118 390MPa peenKSIF 116 390MPa peen0.0001000 20 40 60 80 100IARPO3a + 5ML SpectraA0.0010 20 40 60 80 100IARPO3a + 5ML SpectraFigure 18 The result of the quantitative fractographic exam<strong>in</strong>ation of cracks <strong>in</strong> the peened specimens loadedto a peak stress of 390MPa.B16