Fatigue Crack Growth in 7050T7451 Aluminium Alloy Thick Section ...
Fatigue Crack Growth in 7050T7451 Aluminium Alloy Thick Section ...
Fatigue Crack Growth in 7050T7451 Aluminium Alloy Thick Section ...

Create successful ePaper yourself
Turn your PDF publications into a flip-book with our unique Google optimized e-Paper software.
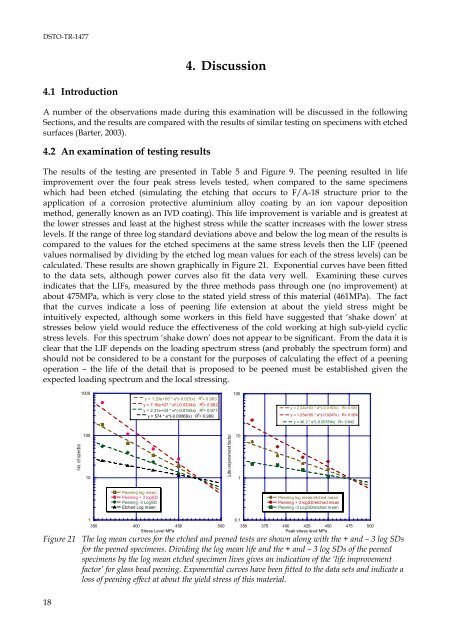
DSTO-TR-14774. Discussion4.1 IntroductionA number of the observations made dur<strong>in</strong>g this exam<strong>in</strong>ation will be discussed <strong>in</strong> the follow<strong>in</strong>g<strong>Section</strong>s, and the results are compared with the results of similar test<strong>in</strong>g on specimens with etchedsurfaces (Barter, 2003).4.2 An exam<strong>in</strong>ation of test<strong>in</strong>g resultsThe results of the test<strong>in</strong>g are presented <strong>in</strong> Table 5 and Figure 9. The peen<strong>in</strong>g resulted <strong>in</strong> lifeimprovement over the four peak stress levels tested, when compared to the same specimenswhich had been etched (simulat<strong>in</strong>g the etch<strong>in</strong>g that occurs to F/A-18 structure prior to theapplication of a corrosion protective alum<strong>in</strong>ium alloy coat<strong>in</strong>g by an ion vapour depositionmethod, generally known as an IVD coat<strong>in</strong>g). This life improvement is variable and is greatest atthe lower stresses and least at the highest stress while the scatter <strong>in</strong>creases with the lower stresslevels. If the range of three log standard deviations above and below the log mean of the results iscompared to the values for the etched specimens at the same stress levels then the LIF (peenedvalues normalised by divid<strong>in</strong>g by the etched log mean values for each of the stress levels) can becalculated. These results are shown graphically <strong>in</strong> Figure 21. Exponential curves have been fittedto the data sets, although power curves also fit the data very well. Exam<strong>in</strong><strong>in</strong>g these curves<strong>in</strong>dicates that the LIFs, measured by the three methods pass through one (no improvement) atabout 475MPa, which is very close to the stated yield stress of this material (461MPa). The factthat the curves <strong>in</strong>dicate a loss of peen<strong>in</strong>g life extension at about the yield stress might be<strong>in</strong>tuitively expected, although some workers <strong>in</strong> this field have suggested that ‘shake down’ atstresses below yield would reduce the effectiveness of the cold work<strong>in</strong>g at high sub-yield cyclicstress levels. For this spectrum ‘shake down’ does not appear to be significant. From the data it isclear that the LIF depends on the load<strong>in</strong>g spectrum stress (and probably the spectrum form) andshould not be considered to be a constant for the purposes of calculat<strong>in</strong>g the effect of a peen<strong>in</strong>goperation – the life of the detail that is proposed to be peened must be established given theexpected load<strong>in</strong>g spectrum and the local stress<strong>in</strong>g.1000y = 1.29e+06 * e^(-0.025x) R 2 = 0.983y = 7.16e+07 * e^(-0.0334x) R 2 = 0.962y = 2.31e+04 * e^(-0.0165x) R 2 = 0.971y = 574 * e^(-0.00866x) R 2 = 0.999100y = 2.24e+03 * e^(-0.0163x) R= 0.981y = 1.25e+05 * e^(-0.0247x) R= 0.964y = 40.2 * e^(-0.00789x) R= 0.94210010101Peen<strong>in</strong>g log meanPeen<strong>in</strong>g + 3 logSDPeen<strong>in</strong>g -3 LogSDEtched Log meanPeen<strong>in</strong>g log mean/etched meanPeen<strong>in</strong>g + 3 logSD/etched meanPeen<strong>in</strong>g -3 LogSD/etched mean1350 400 450 500Stress Level MPa0.1350 375 400 425 450 475 500Peak stress level MPa.Figure 21 The log mean curves for the etched and peened tests are shown along with the + and – 3 log SDsfor the peened specimens. Divid<strong>in</strong>g the log mean life and the + and – 3 log SDs of the peenedspecimens by the log mean etched specimen lives gives an <strong>in</strong>dication of the ‘life improvementfactor’ for glass bead peen<strong>in</strong>g. Exponential curves have been fitted to the data sets and <strong>in</strong>dicate aloss of peen<strong>in</strong>g effect at about the yield stress of this material.18