Fatigue Crack Growth in 7050T7451 Aluminium Alloy Thick Section ...
Fatigue Crack Growth in 7050T7451 Aluminium Alloy Thick Section ...
Fatigue Crack Growth in 7050T7451 Aluminium Alloy Thick Section ...

You also want an ePaper? Increase the reach of your titles
YUMPU automatically turns print PDFs into web optimized ePapers that Google loves.
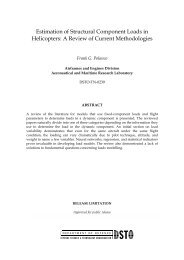
DSTO-TR-14770.120.120.10.10.080.080.060.060.040.040.020.0200 0.02 0.04 0.06 0.08 0.1Type I EPS (measured flaw depth) mm.0.1200 0.02 0.04 0.06 0.08 0.1 0.12Type II EPS mm.99.9999.90.1990.080.060.040.0200 0.02 0.04 0.06 0.08 0.1Type I EPS (measured flaw depth) mm.959080705030201051.1Type I EPS (measured flaw depth) mm.Type II EPS mm.Type IV EPS mm..010.001 0.01 0.1 1EPS flaw depth mm.Figure 33Type II EPS plotted aga<strong>in</strong>st the measured <strong>in</strong>itial flaw depth (Type I EPS). Type VI EPS plottedaga<strong>in</strong>st Type I EPS and the Type IV EPS plotted aga<strong>in</strong>st Type II EPS. The l<strong>in</strong>e <strong>in</strong> each graph<strong>in</strong>dicates the one-to-one ratio. F<strong>in</strong>ally the cumulative probability plot for the three types of EPSis shown with the best fit curves.An exam<strong>in</strong>ation of the mean and SD log data given <strong>in</strong> Table 10 along with the plotted data <strong>in</strong> thef<strong>in</strong>al graph of Figure 33 <strong>in</strong>dicates that although the Type II EPS values are on average smaller thanthe Type IV values, the lower Type IV SD log values results <strong>in</strong> the small value at the 1 <strong>in</strong> 1000 EPSsize, which is not all that different to the value predicted by the measurement of the flaw depth. Itmay be that with sufficient data, for the purposes of prediction, the use of the flaw depth <strong>in</strong> thesepeened specimens, and possibly peened F/A-18 structure, may be sufficient for the prediction of aparts life when consider<strong>in</strong>g the 1 <strong>in</strong> 1000 life po<strong>in</strong>t.The size of the 1 <strong>in</strong> 1000 EPSs, although an ‘imag<strong>in</strong>ary’ measure and not an actual crack size,appears to be about the depth where the peen<strong>in</strong>g ceases to be fully effective and on these groundsit may be predicted that there will be <strong>in</strong>stances where complex shaped aircraft components whichhave been ‘repaired’ by peen<strong>in</strong>g will not receive the expected life extension, and therefore be a32