Fatigue Crack Growth in 7050T7451 Aluminium Alloy Thick Section ...
Fatigue Crack Growth in 7050T7451 Aluminium Alloy Thick Section ...
Fatigue Crack Growth in 7050T7451 Aluminium Alloy Thick Section ...

Create successful ePaper yourself
Turn your PDF publications into a flip-book with our unique Google optimized e-Paper software.
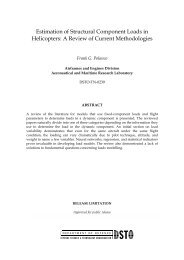
DSTO-TR-1477Simulated flight hours0 40000 80000 120000 16000010Simulated flight hours0 8000 16000 24000 32000 40000 48000100.10.111<strong>Crack</strong> depth mm0.10.010.001<strong>Crack</strong> depth <strong>in</strong>ch<strong>Crack</strong> depth mm0.10.010.001<strong>Crack</strong> depth <strong>in</strong>ch0.010.01360MPa etched slop360MPa peened lower slop360MPa peened high slop0.0001390MPa etched slop390MPa peened lower slop390MPa peened high slop0.00010.0010 100 200 300 400 500 600IARPO3a + 5ML Spectra0.0010 50 100 150IARPO3a + 5ML SpectraSimulated flight hours0 5000 10000 15000 2000010Simulated flight hours0 2000 4000 6000 80001010.110.1<strong>Crack</strong> depth mm0.10.010.001<strong>Crack</strong> depth <strong>in</strong>ch<strong>Crack</strong> depth mm0.10.010.001<strong>Crack</strong> depth <strong>in</strong>ch0.010.01420MPa etched slop420MPa peened lower slop420MPa peened high slop0.0001450MPa etched slop450MPa peened lower slop450MPa peened high slop0.00010.0010 10 20 30 40 50 60 700.0010 5 10 15 20 25 30IARPO3a + 5ML SpectraIARPO3a + 5ML SpectraFigure 32The slopes from the peened and etched crack growth data show<strong>in</strong>g the similar slope of the etchedcrack growth with the f<strong>in</strong>al slope of the peened specimens.4.5 Comparison of EPS resultsThe EPS results for each EPS Type discussed above are summarised <strong>in</strong> Table 9. These results areplotted aga<strong>in</strong>st each other <strong>in</strong> Figure 33 along with the cumulative probability curves. Thecomparison graphs show that although most of the <strong>in</strong>itial flaws had EPS’s similar to theirmeasured depths there were a considerable number of flaws where this was not the case. ThoseEPS’s higher than the l<strong>in</strong>e on the ‘Type II verus Type I’ and ‘Type IV versus Type I’ plots wereusually associated with long shallow flaws and those lower on these graphs, with short deep flaws(which, s<strong>in</strong>ce the long shallow laps were the dom<strong>in</strong>ant flaw <strong>in</strong> the peened specimens, resulted <strong>in</strong>few po<strong>in</strong>ts significantly below the l<strong>in</strong>es). The Type II and Type IV EPS values appear to be verysimilar, although <strong>in</strong> most cases the Type IV EPS values are larger than the Type II EPS values andas such are considered a more conservative measure of the EPS, notwithstand<strong>in</strong>g theacknowledged level of subjectivity that still rema<strong>in</strong>s <strong>in</strong> their derivation.30