Fatigue Crack Growth in 7050T7451 Aluminium Alloy Thick Section ...
Fatigue Crack Growth in 7050T7451 Aluminium Alloy Thick Section ...
Fatigue Crack Growth in 7050T7451 Aluminium Alloy Thick Section ...

Create successful ePaper yourself
Turn your PDF publications into a flip-book with our unique Google optimized e-Paper software.
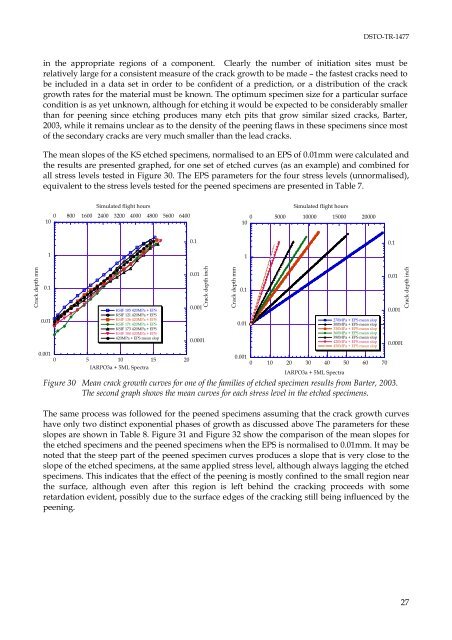
DSTO-TR-1477<strong>in</strong> the appropriate regions of a component. Clearly the number of <strong>in</strong>itiation sites must berelatively large for a consistent measure of the crack growth to be made – the fastest cracks need tobe <strong>in</strong>cluded <strong>in</strong> a data set <strong>in</strong> order to be confident of a prediction, or a distribution of the crackgrowth rates for the material must be known. The optimum specimen size for a particular surfacecondition is as yet unknown, although for etch<strong>in</strong>g it would be expected to be considerably smallerthan for peen<strong>in</strong>g s<strong>in</strong>ce etch<strong>in</strong>g produces many etch pits that grow similar sized cracks, Barter,2003, while it rema<strong>in</strong>s unclear as to the density of the peen<strong>in</strong>g flaws <strong>in</strong> these specimens s<strong>in</strong>ce mostof the secondary cracks are very much smaller than the lead cracks.The mean slopes of the KS etched specimens, normalised to an EPS of 0.01mm were calculated andthe results are presented graphed, for one set of etched curves (as an example) and comb<strong>in</strong>ed forall stress levels tested <strong>in</strong> Figure 30. The EPS parameters for the four stress levels (unnormalised),equivalent to the stress levels tested for the peened specimens are presented <strong>in</strong> Table 7.Simulated flight hours0 800 1600 2400 3200 4000 4800 5600 640010Simulated flight hours0 5000 10000 15000 20000100.10.111<strong>Crack</strong> depth mm0.10.01KSIF 105 420MPa + EPSKSIF 121 420MPa + EPSKSIF 136 420MPa + EPSKSIF 171 420MPa + EPSKSIF 173 420MPa + EPSKSIF 180 420MPa + EPS420MPa + EPS mean slop0.0010 5 10 15 20IARPO3a + 5ML Spectra0.010.001<strong>Crack</strong> depth <strong>in</strong>ch0.00010.10.01270MPa + EPS mean slop300MPa + EPS mean slop330MPa + EPS mean slop360MPa + EPS mean slop390MPa + EPS mean slop420MPa + EPS mean slop450MPa + EPS mean slop0.0010 10 20 30 40 50 60 70IARPO3a + 5ML SpectraFigure 30 Mean crack growth curves for one of the families of etched specimen results from Barter, 2003.The second graph shows the mean curves for each stress level <strong>in</strong> the etched specimens.<strong>Crack</strong> depth mm0.010.0010.0001<strong>Crack</strong> depth <strong>in</strong>chThe same process was followed for the peened specimens assum<strong>in</strong>g that the crack growth curveshave only two dist<strong>in</strong>ct exponential phases of growth as discussed above The parameters for theseslopes are shown <strong>in</strong> Table 8. Figure 31 and Figure 32 show the comparison of the mean slopes forthe etched specimens and the peened specimens when the EPS is normalised to 0.01mm. It may benoted that the steep part of the peened specimen curves produces a slope that is very close to theslope of the etched specimens, at the same applied stress level, although always lagg<strong>in</strong>g the etchedspecimens. This <strong>in</strong>dicates that the effect of the peen<strong>in</strong>g is mostly conf<strong>in</strong>ed to the small region nearthe surface, although even after this region is left beh<strong>in</strong>d the crack<strong>in</strong>g proceeds with someretardation evident, possibly due to the surface edges of the crack<strong>in</strong>g still be<strong>in</strong>g <strong>in</strong>fluenced by thepeen<strong>in</strong>g.27