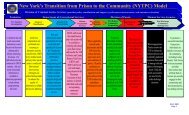
These crimes add an estimated 10% to the cost <strong>of</strong> insurance premiums paid bypolicyholders in <strong>New</strong> <strong>York</strong> <strong>State</strong>. As the legislative findings associated with the creation<strong>of</strong> the Motor Vehicle Theft and Insurance Fraud Demonstration Program point out:“Motor vehicle theft and motor vehicle insurance fraud are a major problem in <strong>New</strong> <strong>York</strong>and costs honest motor vehicle policyholders billions <strong>of</strong> dollars annually. As the cost <strong>of</strong>motor vehicle insurance continues to rise, this essential coverage has become lessaffordable and more out <strong>of</strong> reach for many <strong>New</strong> <strong>York</strong>ers.”Since 1997, <strong>New</strong> <strong>York</strong> <strong>State</strong> had experienced an alarming increase in the reportsfor suspected incidents <strong>of</strong> motor vehicle insurance fraud (MVIF)from insurers in the<strong>State</strong> with the greatest increase occurring in no-fault related fraud. Suspected reports<strong>of</strong> MVIF to the <strong>State</strong> Insurance Frauds Bureau includes fraudulent reports <strong>of</strong> vehicletheft, vehicle fire (arson), larceny from vehicle, vehicle vandalism, vehicle collisiondamage, billing and no-fault. In 1997, 13,939 incidents <strong>of</strong> MVIF were reported and by2003, the number had increased by 39.4% to 24,282. Due to targeted enforcement,enhanced prosecution and changes in <strong>New</strong> <strong>York</strong> <strong>State</strong> insurance laws MVIF decreasedby 32.9% from 2003 to 2007.Since the economic downturn began in <strong>New</strong> <strong>York</strong> <strong>State</strong> has experienced, anincrease <strong>of</strong> MVIF <strong>of</strong> 16,276 suspected incidents in 2007 to 17,185 as compared to18,368 incidents in 2008. This has greatly contributed to the fact that the average cost<strong>of</strong> motor vehicle insurance for <strong>New</strong> <strong>York</strong> <strong>State</strong> residents is the third highest in the nationbehind Michigan and <strong>New</strong> Jersey.30000Motor Vehicle Insurance FraudSuspected Incidence in <strong>New</strong> <strong>York</strong> <strong>State</strong>2500020000150001000013,939 13,92320,76224,28219,29816,27618,368All Fraud500001997 1999 2001 2003 2005 2007 2009In 2009, the <strong>New</strong> <strong>York</strong> City Region experiences 70% <strong>of</strong> the suspected incidence<strong>of</strong> motor vehicle insurance fraud reported to the <strong>State</strong> Insurance Frauds Bureau with19% <strong>of</strong> those incidents reported for the Region <strong>of</strong> suburban counties: Nassau,NYS DIVISION OF CRIMINAL JUSTICE SERVICES MVTIFP BOARD / ANNUAL REPORT 2009 Page 10
Rockland, Suffolk, and Westchester. On average, the cost <strong>of</strong> motor vehicle insurance inthese regions is much greater than the rest <strong>of</strong> <strong>New</strong> <strong>York</strong> <strong>State</strong>.Motor Vehicle Insurance Fraud by Region2% 2% 1% 0%2% 0%18%3%72%NYCNYC SuburbsWesternMid HudsonFinger LakesCapital DistrictCentralSouthern TierNorthernMotor Vehicle Insurance Fraud - 2008 – 2009Top Ten CountiesCounty 2008 2009 ChangeKings 4,416 4,908 11.1%Queens 3,282 3,483 6.1%Bronx 1,859 2,336 25.6%<strong>New</strong> <strong>York</strong> 1,704 1,164 -31.6%Suffolk 1,377 1,396 1.3%Nassau 1,534 1,369 -10.7%Richmond 454 544 19.8%Erie 411 429 4.3%Westchester 416 424 1.9%Monroe 209 226 8.1%Although <strong>New</strong> <strong>York</strong> City has documented declining reports <strong>of</strong> motor vehicle theft,the City <strong>of</strong> <strong>New</strong> <strong>York</strong>, as a region, still has the highest rates <strong>of</strong> motor vehicle insurancefraud (111.7 per 100,000) in the <strong>State</strong>. In 2009, Kings County had the highest rate <strong>of</strong>motor vehicle insurance fraud based on population (191.1 per 100,000 population) andaccounted for approximately 26.7% <strong>of</strong> the reported incidents <strong>of</strong> motor vehicle insurancefraud in the <strong>State</strong> followed by Bronx County (167.1 per 100,000), Queens County (151.2NYS DIVISION OF CRIMINAL JUSTICE SERVICES MVTIFP BOARD / ANNUAL REPORT 2009 Page 11